Vivisecting Mobility Management in 5G Cellular Networks¶
TL; DR:
(1) 研究方法
研究团队在美国进行了超过6200公里的跨州驾驶测试,收集了三大运营商超过4.7万次切换的跨层数据集。这些数据全面覆盖了独立组网(SA)、非独立组网(NSA)以及低频、中频和毫米波(mmWave)等不同频段
(2) 切换特性与代价
与4G相比,NSA 5G的切换更为频繁,平均每0.4公里就会发生一次,而覆盖范围较小的毫米波频段更是高达每0.13公里发生一次
NSA 5G的平均切换耗时达到167毫秒,比4G长约1.19倍,主要原因是: 基站准备阶段的跨塔信令交互增加了延迟
在能耗方面,NSA 5G切换消耗的电量是4G切换的1.2到2.3倍
(3) 应用性能影响
频繁且耗时的切换会导致应用体验质量(QoE)出现剧烈波动:
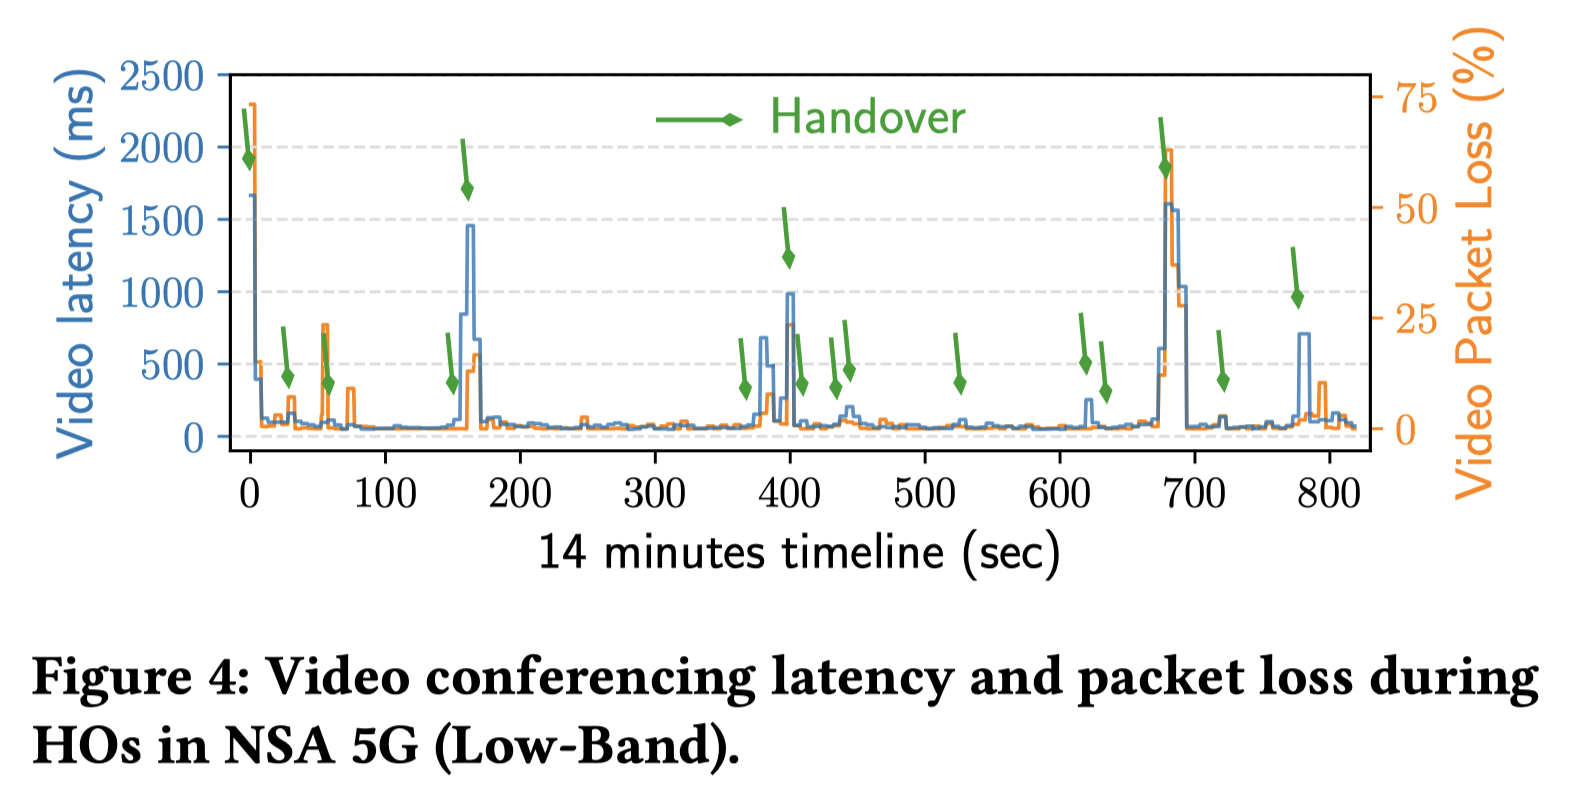
- 在实时视频会议中,切换会导致延迟平均增加2.26倍,丢包率增加2.24倍
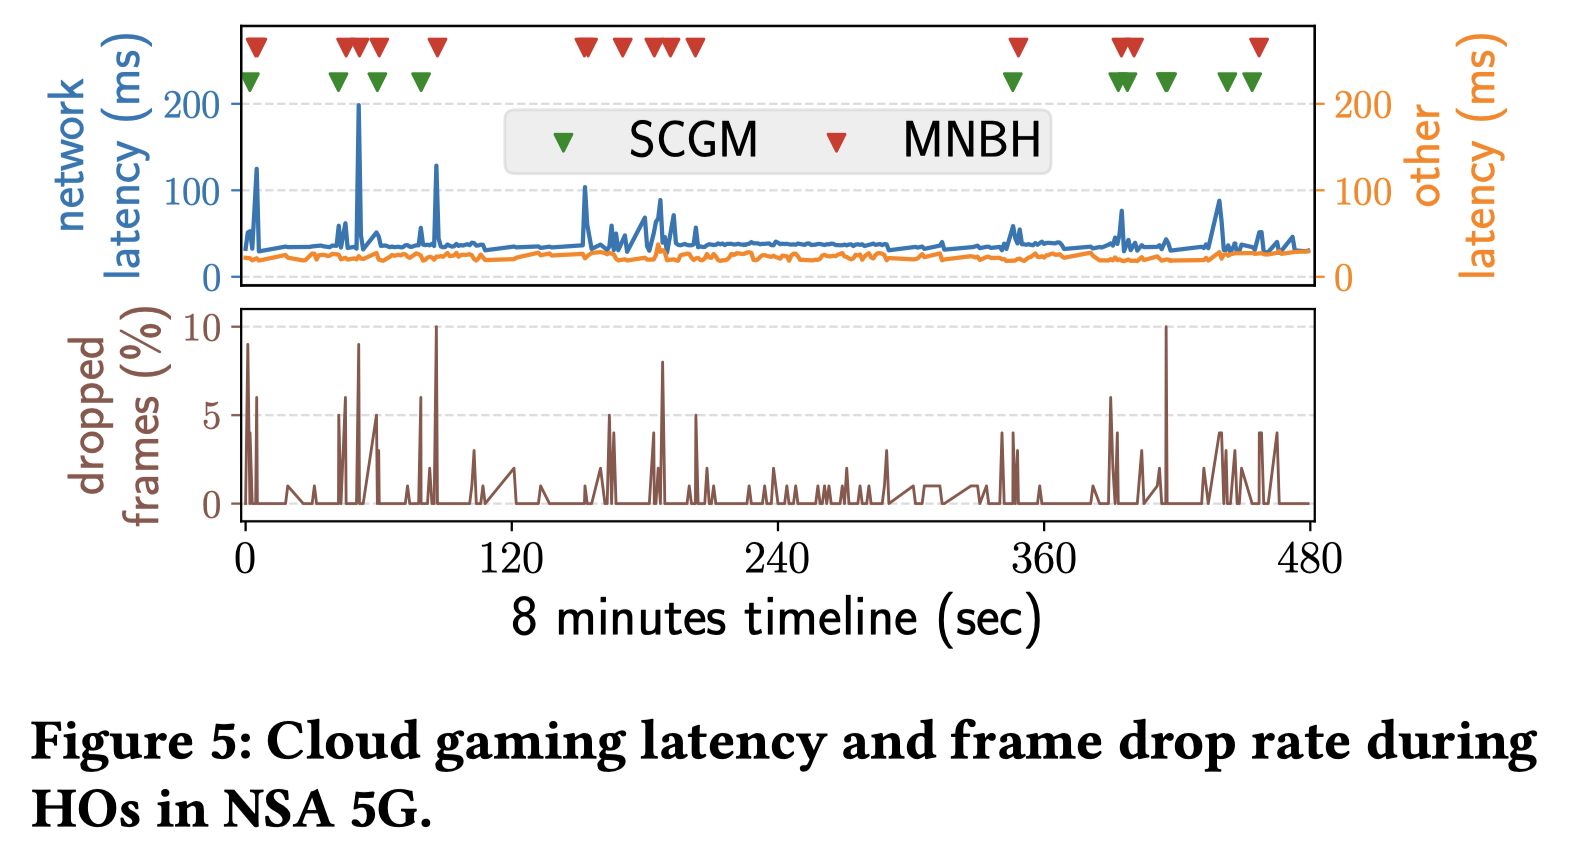
- 云游戏在切换期间的掉帧率会增加2.6倍
- 体积视频流的比特率在毫米波切换时甚至会下降58%
(4) 网络侧痛点
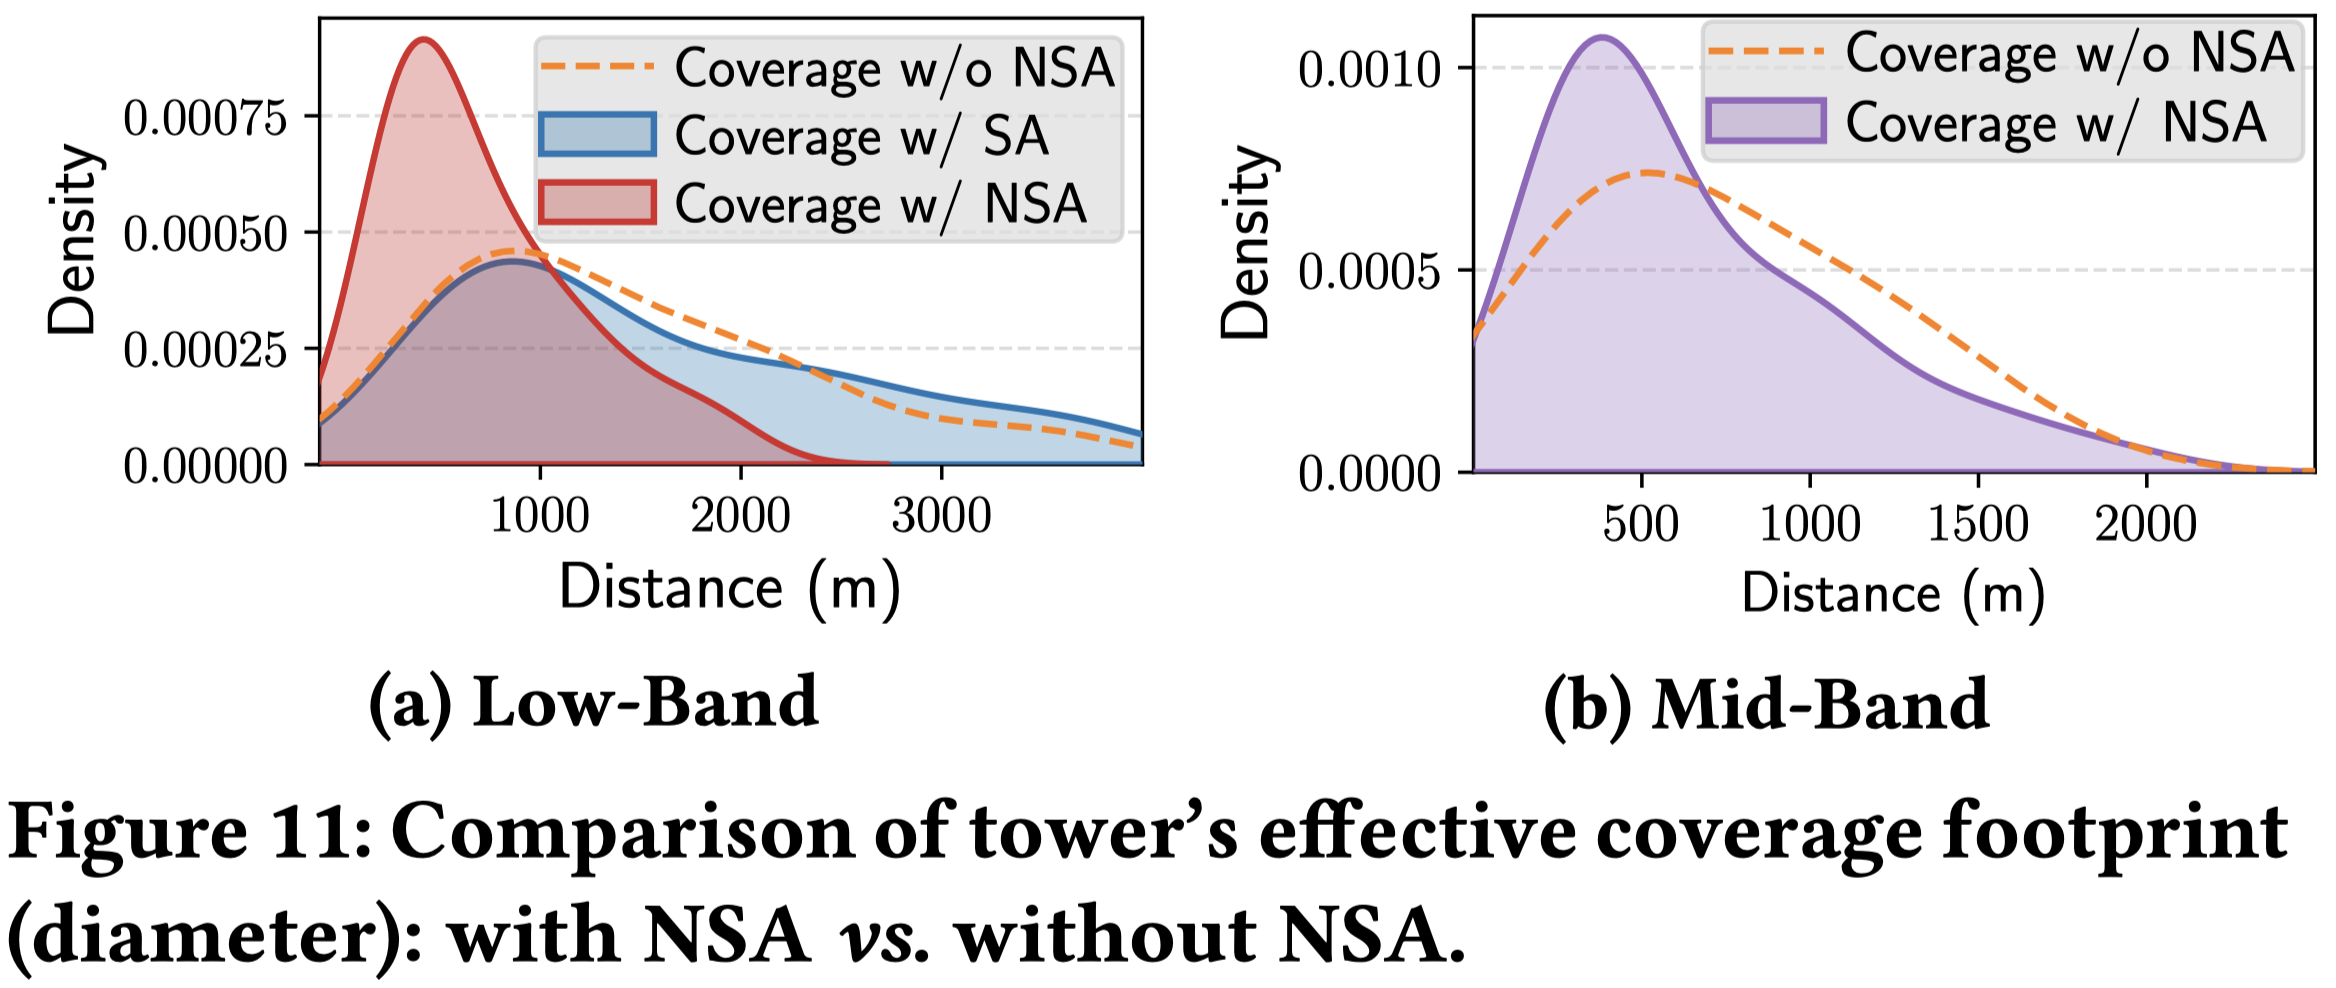
在NSA架构中, 由于 5G数据面强制绑定4G控制面, 导致5G低频段的有效覆盖范围实际上被缩小了约一半
此外, 由于4G和5G基站间缺乏直接同步的切换机制, 部分基站间切换不仅未能改善信号, 反而导致切换后的网络带宽中位数下降了14%
(5) 解决方案 (Prognos)
论文设计了一个名为 Prognos 的预测系统,它无需修改底层网络协议,通过预测信号强度并学习基站的切换逻辑,实现了0.92至0.94的预测F1分数
将该系统提供的预测指标整合到应用的自适应码率算法中,能在不降低画质的情况下减少全景视频流34.6%至58.6%的卡顿时间
Introduction¶
随着5G对多样化无线电频段的支持,移动性管理变得更为复杂。此外,与前几代技术相比,5G小区的覆盖范围通常更小且分布更密集,导致小区之间的切换(Handover, HO)更为频繁。鉴于4G和5G预期将长期共存,3GPP引入了多种5G非独立组网(NSA)架构以及5G独立组网(SA)模式。这些因素进一步加剧了5G切换过程的复杂性:除了在同一技术内的小区之间进行水平切换(例如,5G至5G的低频、中频和高频段切换)外,还存在跨技术的垂直切换(例如,4G至5G以及5G至4G)。
先前在4G/LTE领域以及近期在5G领域的研究表明,频繁的切换会导致5G吞吐量出现剧烈波动,在最坏的情况下,甚至会导致完全的服务“中断”。这些损伤将转化为较差的应用性能,特别是对于5G本应重点支持的低延迟应用,如增强现实/虚拟现实(AR/VR)、边缘卸载以及车联网(V2X)通信。在3G/4G网络中观察到的不当切换配置将进一步加剧这一负面影响。
研究目标、挑战与数据收集
鉴于5G切换的重要性和复杂性,必须透彻理解商业运营商当前采用的5G切换机制与实践。以此为目标,据我们所知,本文开展了首次全面、深入的5G移动性管理研究。与实验室内的实验不同,在真实环境中测量5G切换面临诸多挑战:如何从未获取Root权限的智能手机中获取关键的控制平面信令事件?如何在人力和预算有限的情况下全面调查各种5G架构(SA与NSA)、无线电频段和运营商?如何协调不同层级的数据收集任务?如何准确评估切换对用户设备(UE)能耗的影响?
为克服上述挑战,我们搭建了一个测量平台,该平台包括:(1)多部接入美国三大5G运营商网络的5G智能手机;(2)一款定制软件,用于在非Root智能手机上捕获移动性相关信息;(3)一款专业的测量工具,用于收集蜂窝网络控制平面事件;以及(4)一个配备外部移动电源的物理功率监视器,用于准确分析设备的电池消耗。
利用该平台,我们开展了一次跨国数据收集实地测试,在高速公路(超过5560公里)和多个主要城市(超过712公里)内进行了测量。在收集的超过600GB的日志中,我们在数据集内观察到超过47,000次切换,涵盖多个维度:(1)运营商(标记为OpX、OpY和OpZ);(2)无线电接入技术(5G对比4G);(3)5G网络架构(NSA对比SA);以及(4)5G频段(低频、中频、毫米波/高频)。据我们所知,这构成了目前在行驶里程上最大规模的商业5G网络跨层驾驶测试。利用该独特的驾驶数据集,我们进行了系统性分析,以获取关于5G切换的关键见解并揭示其影响。研究结果表明,主流5G运营商所采用的切换机制确实存在显著差异,并对性能产生了重大影响,具体详述如下。
5G切换如何影响应用性能?(§4)
为研究5G切换对应用体验质量(QoE)的影响,我们考察了三个案例:实时视频会议、实时3D体积视频流以及云游戏。实验表明,5G切换对应用QoE有显著的不利影响(如视频会议延迟增加2.26倍,云游戏掉帧增加3.64倍),其严重程度取决于切换类型、频段和无线接入技术。由于毫米波的短覆盖距离和方向性,毫米波5G应用在切换期间遭受的性能波动远高于中低频段。
5G切换的关键特征是什么?(§5)
调查发现,5G切换触发极为频繁,NSA 5G高速公路上平均每0.4公里触发一次切换,而毫米波5G更高达每0.13公里一次。在切换时长方面,NSA 5G平均切换耗时167毫秒,比4G长约1.19倍,主要因为基站间的决策准备阶段显著延长。此外,5G切换的能耗开销十分可观,单次切换消耗的电量显著高于4G,凸显了减少切换信令消息的重要性。
5G切换对运营商的启示是什么?(§6)
研究揭示了现有部署的数个痛点。首先,由于NSA 5G的数据平面(低频)绑定了4G的控制平面(中频),实际上削减了低频5G的有效覆盖范围。其次,由于缺乏直接同步机制,部分5G基站间的切换反而导致带宽中位数下降14%。最后,4G与5G基站是否共址会极大影响跨塔通信的延迟,这为NSA运营商优化切换决策提供了参考。
能否通过预测5G切换来提升应用QoE?(§7)
本文开发了一个名为Prognos的稳健切换预测框架,利用信号强度读数、测量报告和历史记录来预测未来的切换行为。Prognos采用两阶段预测流水线,预测4G/5G切换的F1分数达到0.92-0.94,显著优于现有基线方法。将Prognos集成至16K全景视频和体积视频流应用的自适应码率算法中,能够在不降低画质的情况下减少34.6%-58.6%的卡顿时间,大幅提升应用的QoE。
Mobility Management Today¶
Cellular carriers dispense their services by laying out a blanket of cellular towers around an area. Cellular towers can manage multiple cells (antennas), each of which covers a geographical area. PCI (Physical Cell ID) is the identifier used for cells at the physical layer. For any mobile device, its primary cell is considered to be the backbone of cellular connection. It provides basic control plane signaling (e.g., connection establishment, HO management, and security) along with data services to the user equipment (UE). In addition, a UE (e.g., a smartphone device) can subscribe to multiple secondary cells for higher bandwidths. With the data flowing from a UE via a cellular tower to the 4G/5G core, mobility management procedures (e.g., HOs, MRs, etc.) are employed to switch between cells and continuously report on the signal quality of UE.
基础概念:主副基站的搭配
在通信网络中,物理小区(可以简单理解为基站的某根天线覆盖的区域)通过PCI来编号识别。
手机在移动时,不仅会连接一个负责发号施令、维持安全和基础连接的“主小区”,还可以同时连接多个“辅小区”来叠加网速。
当手机移动时,网络需要不断调度,让手机切换到信号更好的小区,这个过程就叫移动性管理(切换,HO)。
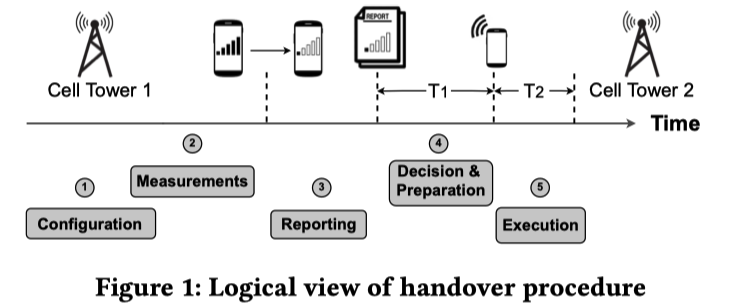
HO Procedures. Fig. 1 depicts a basic HO procedure; the detailed description of all steps is in Appendix A.1. Carriers use multiple radio signal quality indicators such as Reference Signal Received Power (RSRP), Reference Signal Received Quality (RSRQ), Signal to Interference & Noise Ratio (SINR), etc. [8] to perform measurements based on the configurations received from the primary cell. We refer to these radio quality indicators as RRS (RSRP, RSRQ, SINR) for the rest of the paper. If any event trigger criterion is met, a measurement event is raised and its report is sent to the primary cell. The primary cell then decides a target cell based on carrierspecific HO logic and directs UE to perform HO with the target cell via an HO command (RRC Connection Reconfiguration [10]). Finally, the UE undergoes HO and performs link synchronization through Random Access Procedure [14].
常规的切换过程是如何进行的?
-
打分与报告:
- 手机会根据主小区的要求,时刻测量周围信号的质量(文中使用RSRP等专业指标,统称为RRS)
- 一旦发现更好的信号或当前信号太差触发了阈值,手机就会向主小区提交“测量报告(MR)”
-
决策与执行:
- 主小区收到报告后,判断并挑选出一个最佳的目标小区,然后向手机下发“切换命令”
- 手机接到命令后,通过特定的接入(RA)程序与新基站建立连接
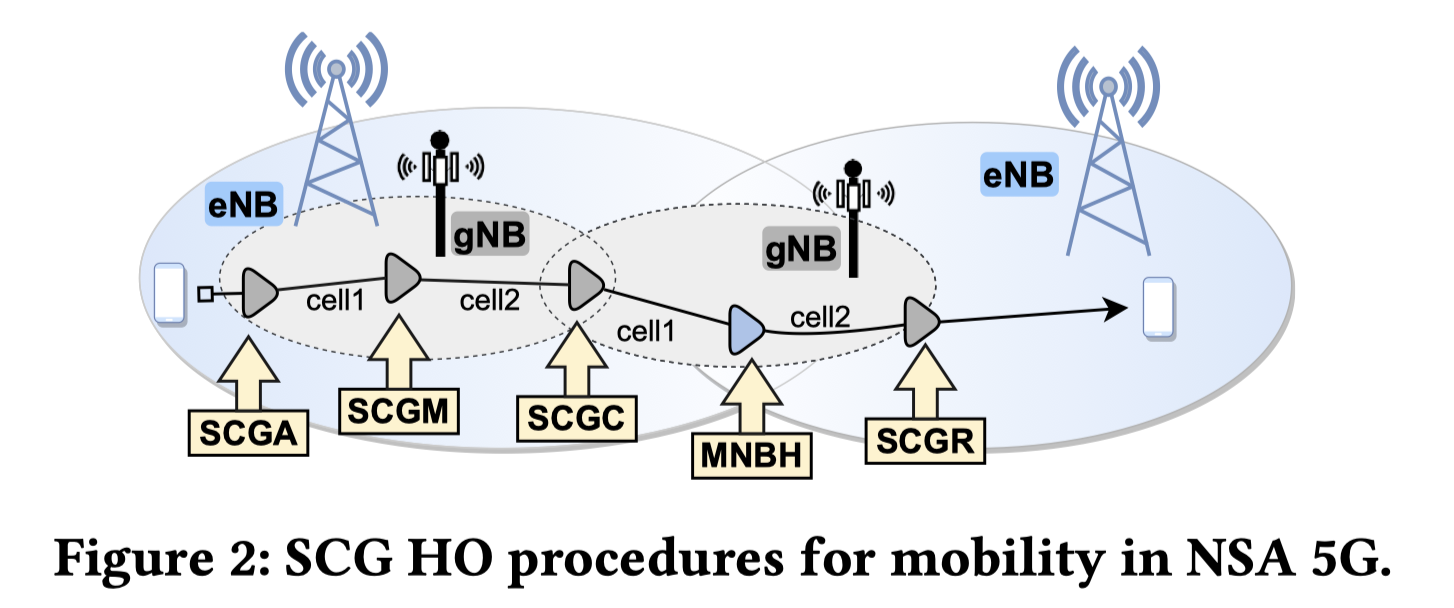
HOs in 5G: A Taxonomy. The classification of HOs has become complex in 5G; Table 2 summarizes the radio access technology change and 4G/5G HO category for each HO type used in the paper. In NSA 5G, all the cells associated with eNB constitute a master cell group (MCG). On the other hand, the group of cells linked to the gNB form a secondary cell group (SCG). A new category of HO procedures was introduced in 3GPP Release-15 [4] for SCG HO management. Fig. 2 provides an overview of SCG HO procedures used to add, modify and release 5G cells. SCG Addition adds 5G-NR cells to the existing LTE connection while SCG Release removes them. SCG Modification is used to switch 5G cells within the same SCG (or gNB). Unlike inter-eNB HO in LTE, NSA 5G does not have an option to perform a direct HO between two gNBs. Hence, the SCG Change procedure (a combination of SCG Release and Addition) is used to move the UE from one gNB to another. A master-eNB (MeNB) HO will change the LTE cell while keeping the gNB the same. In SA 5G, we only observe MCG HO that moves the UE from one 5G-NR cell to another.
NSA 5G(非独立组网)架构下的复杂切换:
在目前主流的NSA 5G网络中,手机是同时连接4G基站(作为主小区组 MCG)和5G基站(作为辅小区组 SCG)的,这就导致切换变得极其复杂:
-
5G基站的内部微调:
- SCG添加(给当前4G连接增加5G网速)
- SCG释放(断开5G回到纯4G)
- SCG修改(在同一个5G基站的不同Cell之间切换)
-
跨5G基站的痛点(SCG Change):
- 这是NSA架构的一个巨大缺陷!
- 手机不能直接从A号5G基站跳到B号5G基站
- 它必须先“释放”A号5G基站,然后再“添加”B号5G基站,这个断开再重连的组合动作被称为“SCG变更”
-
仅换4G基站(MeNB HO):
- 手机保持当前的5G基站连接不动,只更换底层负责控制的4G基站
SA 5G(独立组网)的极简切换
在真正的纯5G架构(SA)下,由于抛弃了4G作为控制面,手机只需要在5G基站之间进行直接的主小区切换(MCG切换),整个机制回归了简单的直接交接。
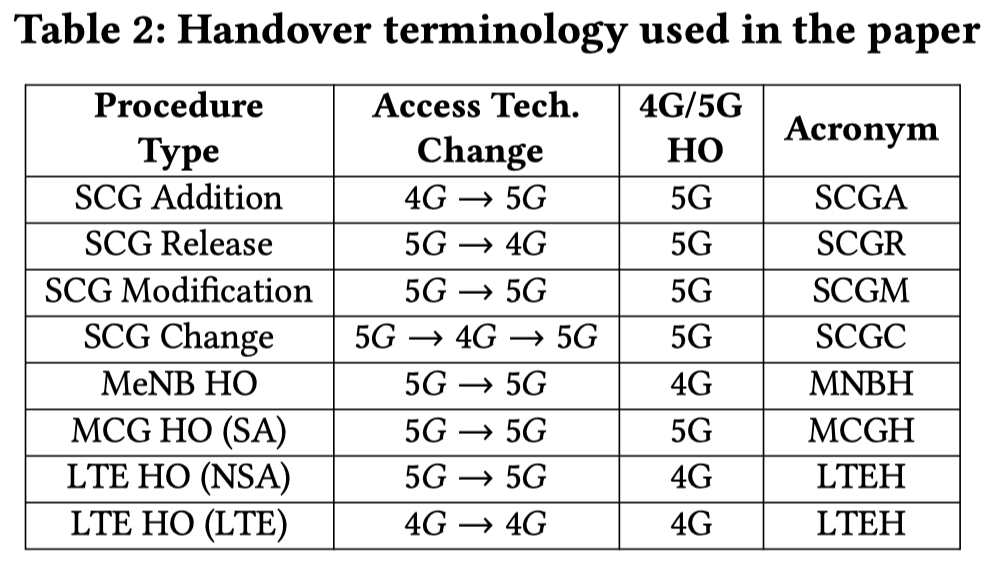
-
SCG Addition (SCGA - 辅小区组添加):
- 在现有的4G LTE连接基础之上,为设备增加5G网络(5G-NR)小区,实现从4G连接到4G+5G双连接的接入技术转变(\(4G \rightarrow 5G\))
- 控制面变化:保持在原LTE eNB(无变化)
- 数据面变化:在原LTE eNB数据链路的基础上,增加5G gNB作为高速数据传输通道
-
SCG Release (SCGR - 辅小区组释放):
- 断开当前的5G网络连接,使设备退回到纯4G连接状态(\(5G \rightarrow 4G\))
- 控制面变化:保持在原LTE eNB(无变化)
- 数据面变化:移除5G gNB,数据传输完全退回至LTE eNB
-
SCG Modification (SCGM - 辅小区组修改):
- 在同一个5G基站(gNB)的覆盖范围内,将设备从当前 5G Cell 切换到另一个 5G Cell(\(5G \rightarrow 5G\))
- 控制面变化:保持在原LTE eNB(无变化)
- 数据面变化:5G数据链路在同一个5G gNB内部的不同天线/小区之间进行切换
- PS: SCGM 属于基站内部切换
- 一个5G基站通常管理多个不同的天线(小区)
- 当设备从该基站的“天线A”移动到“天线B”时,由于始终在同一个基站的管理下,系统可以直接在内部完成资源重新分配和无缝交接
-
SCG Change (SCGC - 辅小区组变更):
- 由于 NSA 不支持在两个不同的5G基站之间直接进行切换,该过程实际上是“SCG释放”与“SCG添加”的组合操作
- 即:先断开原5G基站回到4G,再连接到新的5G基站(\(5G \rightarrow 4G \rightarrow 5G\))
- 控制面变化:保持在原LTE eNB(无变化)
- 数据面变化:先断开源5G gNB,数据短暂回落至LTE eNB,随后再连接并转移至新的目标5G gNB
- PS: SCGC 属于跨基站切换
- 当设备从“5G基站甲”移动到“5G基站乙”时,由于 NSA 架构存在局限,基站甲和基站乙之间无法直接通信以交接用户数据
- 因此,设备必须先彻底断开基站甲的5G连接(暂时退回纯4G状态),然后再重新向基站乙发起全新的5G连接
-
MeNB HO (MNBH - 主eNB切换):
- 保持设备当前的5G辅小区(gNB)连接不变,仅对负责控制面的4G主基站(LTE小区)进行切换
- 控制面变化:从源LTE eNB切换到目标LTE eNB
- 数据面变化:5G gNB的数据连接保持不变,4G层面的数据链路随之切换至目标LTE eNB
-
MCG HO (SA) (MCGH - 独立组网主小区组切换):
- 仅存在于真正的 5G SA 模式中,代表设备直接从一个纯5G主小区平滑切换到另一个纯5G主小区(\(5G \rightarrow 5G\))
- 控制面变化:从源5G gNB直接切换到目标5G gNB
- 数据面变化:从源5G gNB直接切换到目标5G gNB
-
LTE HO (LTEH - 4G切换):
- 指4G网络层面的标准切换
- 在NSA架构下(LTE HO NSA),4G控制面的切换可能会同时维持5G连接;而在纯4G网络中(LTE HO LTE),则是完全的4G基站间交接(\(4G \rightarrow 4G\))
- 控制面变化:从源LTE eNB切换到目标LTE eNB
- 数据面变化:从源LTE eNB切换到目标LTE eNB
Measurement Methodology¶
5G HO Measurement Tool. We extend 5G Tracker [52] to capture several key pieces of information relevant to mobility management in commercial 5G: PCIs, HOs, and radio bands. The above information is extracted from 5G-specific APIs introduced in Android 11 [16]. Regarding the last item, we use the onDisplayInfoChanged() API of Android TelephonyManager to identify the radio band (low-band vs. mmWave) of the UE. Our app also logs additional information such as UE’s geolocation, radio technology (4G/LTE vs. 5G), ping measurements, etc.
5G UE and Other Measurement Tools. We use two UE models: Samsung Galaxy S21 Ultra 5G/SM-G998U (S21U) and Samsung Galaxy S20 Ultra 5G/SM-G988U (S20U). A total of four mobile phones (three S21U and one S20U) are used in our study. They are equipped with the Qualcomm Snapdragon 888 and 865 chipsets, respectively [25, 26]. The radio hardware profile of these chipsets represent the state-of-the-art, and the measurement findings hold true for other 5G smartphone models, especially Qualcomm models. To ensure a fair comparison among carriers, we place multiple smartphones side-by-side to concurrently conduct experiments and make external factors (e.g., driving speed, location, etc.) remain consistent. Acquiring and parsing lower layer information from smartphones requires access to Diag (diagnostic interface), which needs special licenses and tools [23]. Therefore, we rely on a professional tool called Accuver XCAL [15] to read Qualcomm Diag. This tool runs on a laptop and can collect physical layer radio KPIs (e.g., PCI, RRS values) and RRC layer signaling messages [10] (such as HO commands, event configurations, measurement reports, etc.). For power measurements, we use Monsoon Power Monitor [22] to power a high-end S20U smartphone. Note that all experiments except power measurements use S21U.
5G and 4G Networks. Our analysis focuses on three dimensions: (1) 5G Carriers: We collected data across three major U.S. 5G carriers (OpX, OpY, OpZ). (2) Radio Access Technologies (RAT): We compare different radio technologies (LTE vs. NSA 5G vs. SA 5G). At the time of this study, both OpX and OpZ had deployed their 5G services in NSA while OpY was in both SA and NSA modes. (3) Radio Frequency Bands: The bands considered in this study were dictated by how carriers rolled out their services in the areas we covered. In 5G-NR, we capture mmWave and low-band data for OpX and OpZ. For OpY, we collect data from their mid-band and low-band 5G deployments. Additionally, the 4G/LTE dataset contains low-band and mid-band ranges for all carriers.
Drive Tests. To conduct drive-tests across major cities and interstate freeways in the U.S., we tether three S21U smartphones - one for each carrier - to a laptop running XCAL via USB3 cables (Fig. 3). As summarized in Table 1, our field trip covers a total travel distance of 6,200 km+. The city data mostly comprises of dense deployments and mmWave 5G coverage, while the inter-state data loosely represents suburban deployments and Low-Band 5G coverage. This helps us understand key mobility configurations employed by commercial 5G networks and their impacts in a large scale. Most of the data is collected while driving. For analysis where walking data is used, we mention it before discussing the results.
Profiling Applications under Mobility. In order to understand the impact of mobility on application QoE, we utilize three existing mobile applications shown in Fig. 3: (i) real-time volumetric video streaming leverages a state-of-the-art system (ViVo) [40], (ii) cloud gaming adopts three popular games cloud-powered on Steam Remote Play [28], and (iii) live video conferencing utilizes a popular application, Zoom [31]. The detailed experimental setup can be found in Appendix A.2. All the applications are tested with OpX (NSA Low-Band, NSA mmWave, and LTE) while driving. UDP/TCP Experiments. Using a bulk transfer application iPerf3 [12], we study the impact of mobility on transport layer performance. We use two flavors of TCP congestion control: CUBIC [30] and BBR [29]. The iPerf server runs on an AWS EC2 instance (g4dn.2xlarge | 8vCPUs | 32GB | Ubuntu 18.04) with 3 Gbps+ network bandwidth. The server captures iPerf logs, packet traces (pcap) and socket statistics (ss) logs [21]. On the UE, we run the iPerf client (cross-complied within 5G Tracker) and collect its logs.
主要介绍了研究团队如何搭建软硬件平台并在真实环境中开展大规模的5G切换测量。核心内容可以概括为以下四个方面:
-
测量工具与测试设备:
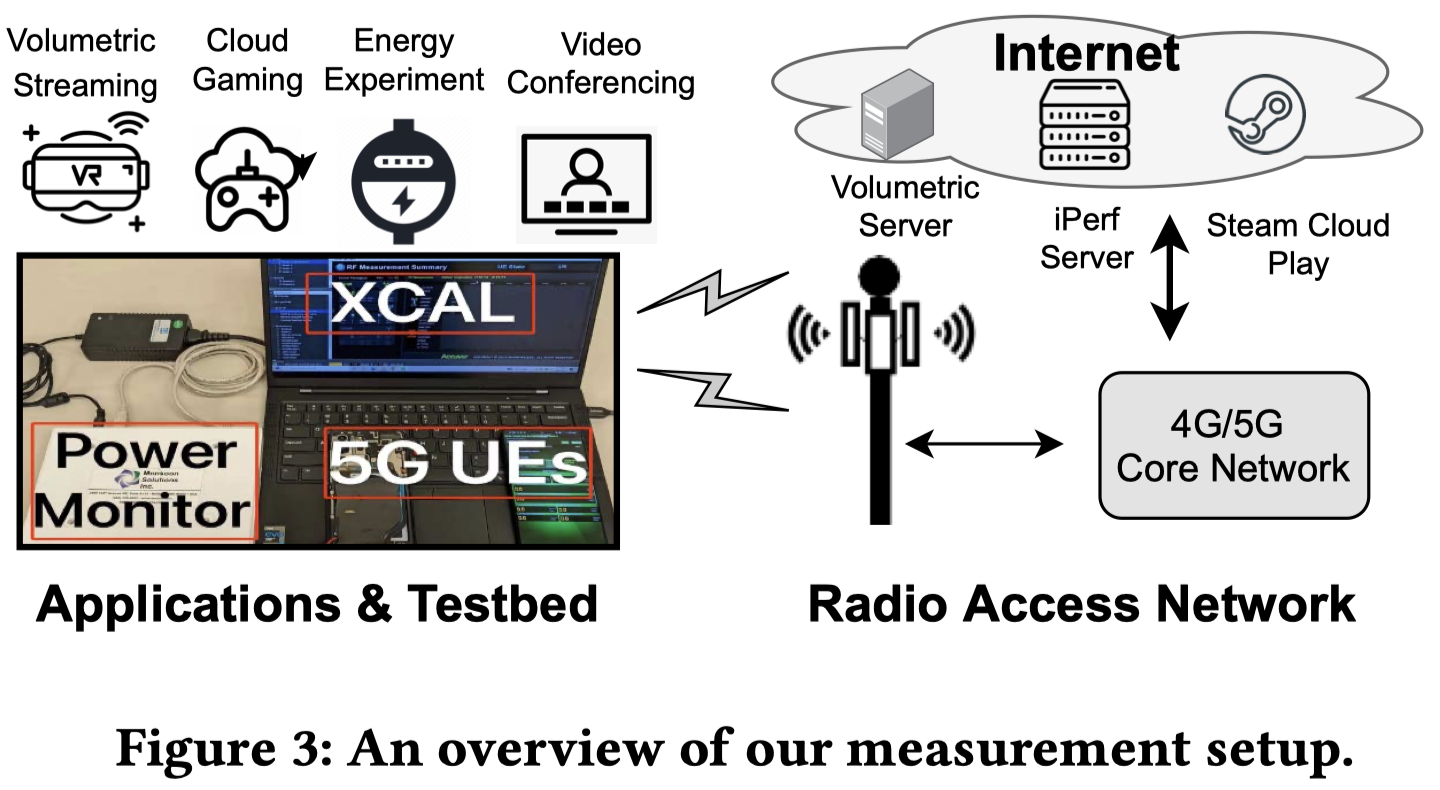
- 软件工具:开发了定制应用“5G Tracker”(利用Android 11 API)来捕获小区的PCI、切换事件和频段等信息
- 硬件设备:使用了三星 Galaxy S21 Ultra 和 S20 Ultra 智能手机
- 专业仪器:
- 为了获取手机底层的物理层指标和RRC层控制信令,研究人员将手机连接至运行Accuver XCAL专业工具的笔记本电脑上
- 同时采用Monsoon物理电源监视器来精确评估设备的电量消耗
-
测量的网络维度:
- 测试涵盖了三个主要变量:
- 美国三大5G运营商(OpX、OpY、OpZ)
- 不同的无线接入技术(4G LTE、NSA 5G、SA 5G)
- 不同的射频频段(低频、中频和毫米波)
- 测试涵盖了三个主要变量:
-
大规模路测设计 (Drive Tests):
- 研究团队携带测试设备进行了超过6200公里的跨州驾驶测试
- 涵盖了主要城市内部(代表密集的毫米波网络部署)以及州际高速公路(代表郊区的低频段网络覆盖)
- 为了保证对比公平,三家运营商的手机被并排放置并同时进行测试
-
移动状态下的应用性能评估:
- 为了量化网络切换对上层应用的影响,研究选用了三款具有代表性的移动应用进行测试:
- 实时体积视频流(ViVo)
- 云游戏(基于Steam Remote Play)
- 实时视频会议(Zoom)
- 此外,还使用 iPerf3 测试了移动环境下的TCP/UDP传输层性能
- 为了量化网络切换对上层应用的影响,研究选用了三款具有代表性的移动应用进行测试:
Impact of Mobility on Application Performance¶
-
实时视频会议体验受损:
- 5G网络切换会显著增加网络延迟和丢包率,导致平均延迟增加2.26倍(极端情况下高达14.5倍),平均丢包率增加2.24倍
-
云游戏体验受切换类型影响:
- NSA架构中不仅包含5G切换,还包含4G切换
- 其中: 4G控制面的切换(如MNBH)对体验的破坏大于5G数据面的切换(如SCGM)
- MNBH会导致网络延迟进一步上升,并使掉帧率增加65%
-
体积视频流受无线频段制约:
- 高频段切换对应用体验质量(QoE)的负面影响远大于低频段
- 毫米波切换会导致视频比特率中位数下降58%、延迟激增107%,而低频段切换仅导致比特率下降31%、延迟增加41%
-
NSA流量模式(双连接与纯5G)的性能权衡:
- 网络部署模式会决定切换时的抗波动能力
- 双连接模式(同时利用4G和5G传输数据)能够吸收切换带来的波动,RTT(往返时延)仅变化1%至4%
- 纯5G模式在无切换时基础延迟更低,但在切换发生时RTT会大幅膨胀37%至58%
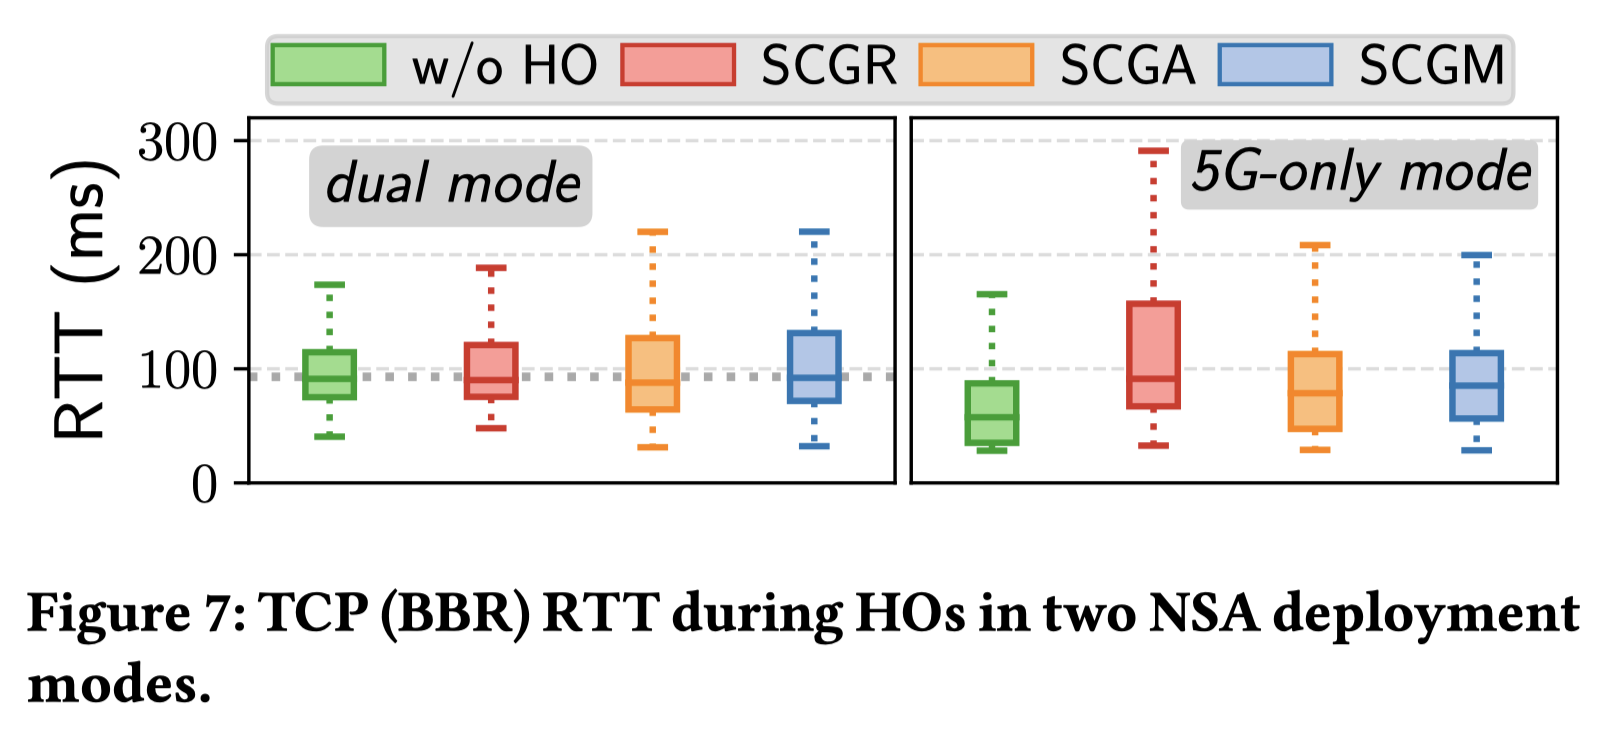
三个重要结论
- 没有 HO 时: 5G-Only 的 RTT 更低
- 原因:
- Dual Mode: 5G data -> eNB -> gNB
- 5G-Only Mode: 5G data -> gNB
- 原因:
- DualMode 的 RTT 没啥变化
- 原因: 5G 数据面虽然中断, 但是 4G 控制面没有任何影响
- DualMode 比 5G-Only Mode 更不容易受波动影响
- 原因: Dual 的双接口能起到”吸收波动”的作用
Characteristics of 5G Handover¶
Motivated by our findings in §4, we systematically investigate the key characteristics of handovers (HOs) in 5G using our large dataset. We focus on three key aspects that affect the UE performance: HO frequency, HO duration, and HO energy consumption by UE.
5.1 Handover Frequency¶
We use our drive test data to quantify the frequency of HOs across radio access technologies (4G vs. 5G), architectures (SA vs. NSA), and bands (low-band vs. mid-band vs. mmWave). Our findings suggest that compared to 4G, HOs become more frequent in NSA 5G. Specifically, in our freeway drive tests (Table 1), NSA 5G HOs are triggered every 0.4 km on average, in contrast to every 0.6 km for 4G HOs. As NSA uses 4G as control plane and 5G as data plane, both NSA-4C and 5G-NR HOs are triggered on the UE. This leads to more frequent HOs in NSA 5G when compared to 4G. On the other hand, SA 5G experiences an HO every 0.9 km. This suggests that SA realizes the performance benefits promised by 5G and reduces HO overheads [61]. For different bands within NSA, mmWave 5G sees a HO every 0.13 km, mid-band every 0.35 km, and low-band every 0.4 km. The frequency of HOs in NSA mmWave is particularly high due to the small coverage of mmWave 5G cells (§6.1). This leads to high energy inefficiency as will be measured in §5.3.
We also compare HO-related signaling overheads across all radio access technologies (LTE vs. NSA vs. SA) and bands (low-band vs. mmWave). Specifically, we include three message types for RRC Layer (Measurement Reports, RRC Reconfiguration, and RRC Reconfiguration Complete [10]). We also consider Random Access (RACH) procedure on MAC layer [5] and SSR measurements (defined in §2) on PHY layer. We find that SA 5G reduces HO-related signaling messages by a factor of ∼3.8× when compared to LTE because of lower HO frequency. Additionally, HO-related signaling, especially PHYlayer procedures, increases significantly (over a 5-fold increase) in NSA mmWave compared to low-band, again due to the small mmWave cell coverage and beam management procedures [2, 53].
5.2 Handover Duration¶
Our application-layer study in §4 identified long 5G HOs to be a leading cause of application performance degradation during user mobility. This is also confirmed by previous studies in LTE [63, 65]. We now conduct an in-depth investigation of 5G HO duration. Overall, we find that HO duration increases significantly in NSA 5G. The average HO duration in NSA 5G is 167 ms, a 119% increase compared to 76 ms for 4G/LTE HOs. SA 5G HOs, on the other hand, are significantly shorter (110 ms) on average despite its high variation. To explain the above results, we split the HO into two stages based on the radio resource control (RRC) processes involved: (i) preparation stage (\(𝑇_1\) ) during which the carrier decides a new cell for HO, and (ii) execution stage (\(𝑇_2\) ) in which the actual HO is performed and the UE connects to a new cell.
[\(𝑇_1\)] HO Preparation Stage. \(𝑇_1\) is key when deciding and preparing a new cell for HO, and it accounts for 41% of the overall HO duration in NSA 5G. Once the primary cell is notified about a measurement event via MR, it uses the carrier-specific HO logic to decide whether to perform a HO. If yes, the source cell requests the target cell to allocate radio resources for the incoming UE [11]. As HO is performed when UE’s signal strength is bad, a long \(𝑇_1\) duration causes the UE to stay in worse network conditions for a prolonged time. Fig. 8 shows the time consumed by OpY in\(𝑇_1\) stage across their deployments: LTE vs. NSA vs. SA. We clearly notice that NSA 5G takes on average 92 ms (which is almost 48%) more time than LTE. This delay in NSA 5G is very likely due to additional signaling overheads. For instance, HOs in NSA 5G involve communication between distributed identities (eNB and gNB) that may or may not be co-located [4, 60]. On the other hand, the median time spent on \(𝑇_1\) phase by SA 5G is comparable and to some extent slightly better than LTE. But, SA 5G still experiences large variance in the time spent on \(𝑇_1\) . We suspect that SA 5G is still in rudimentary stages leading to high variations in HO duration. However, due to limited visibility into carrier’s network, we are unable to confirm this. Later, we also explore how carriers can reduce \(𝑇_1\) by intelligently configuring their HO decision logic (§6.3).
[\(T_1\)] 切换准备阶段。 \(T_1\)在决定和准备用于切换(HO)的新小区时至关重要,它占据了NSA 5G总切换时长的41%。
一旦主小区通过测量报告(MR)接收到关于测量事件的通知,它便会利用运营商特定的切换逻辑来决定是否执行切换。若决定执行,源小区将请求目标小区为即将接入的用户设备(UE)分配无线电资源。
由于切换通常在UE信号强度较差时触发,漫长的\(T_1\)持续时间会导致UE长时间滞留于恶劣的网络条件中。
图8展示了运营商OpY在其LTE、NSA以及SA部署中\(T_1\)阶段所消耗的时间。我们清晰地观察到: NSA 5G平均比LTE多耗时92毫秒(增加了近48%)。
NSA 5G中的这一延迟极有可能是由额外的信令开销造成的。例如,NSA 5G中的切换涉及分布式实体(eNB与gNB)之间的通信,而这些实体可能共址,也可能不共址。
另一方面,SA 5G在\(T_1\)阶段耗时的中位数与LTE相当,甚至在某种程度上略优于LTE。但是,SA 5G在\(T_1\)阶段的耗时仍表现出较大的方差。
我们推测这可能是因为SA 5G仍处于部署的初级阶段,从而导致了切换时长的高度波动。
然而,由于对运营商网络的可见性有限,我们目前无法确证这一点。在后文中,我们还将探讨运营商如何通过智能配置其切换决策逻辑来缩减\(T_1\)(详见§6.3)。
[\(𝑇_2\)] HO Execution Stage. Compared to \(𝑇_1\) , \(𝑇_2\) has more direct impacts on upper-layer performance, and it accounts for ∼59% of the overall HO duration in NSA 5G. During this phase, the HO from a source cell to a target cell is performed. Additionally, the data plane operations are completely halted 1 , hence the duration spent on \(𝑇_2\) is critical to upper-layer application performance and user QoE. The HO ends with a successful completion of RACH procedure. Due to additional signaling overheads [10, 65], NSA 5G leads to a higher \(𝑇_2\) that is 1.4-5.4× compared to LTE. Within NSA 5G, mmWave band incurs 42∼45 % larger \(𝑇_2\) time than low-band, despite the fact that the RACH procedure (part of \(𝑇_2\) ) takes less time in mmWave when compared to low-band due to shorter PRACH formats [7]. We suspect that beam management procedures involved in performing the complex beam tracking, searching, selection, etc. result in higher \(𝑇_2\) in mmWave 5G [2, 53].
[\(T_2\)] 切换执行阶段。 与\(T_1\)相比,\(T_2\)对上层性能具有更直接的影响,且占据了NSA 5G总切换时长的约59%。
在此阶段,系统执行从源小区到目标小区的切换。
此外,由于数据面操作被完全中止,在\(T_2\)上耗费的时间对上层应用性能和用户体验质量(QoE)至关重要。
切换过程以随机接入(RACH)过程的成功完成而告终。
由于额外的信令开销,NSA 5G的\(T_2\)时长显著增加,达到LTE的1.4至5.4倍。在NSA 5G内部,尽管毫米波(mmWave)由于PRACH格式较短使得RACH过程(作为\(T_2\)的一部分)耗时少于低频段,但毫米波频段的\(T_2\)总时长仍比低频段长42%至45%。我们推测,执行复杂的波束跟踪、搜索和选择等操作时所涉及的波束管理过程,导致了毫米波5G中更长的\(T_2\)。
Overall, the above decomposition highlights the complexities involved in 5G HOs. In particular, in NSA, the dependency of 5G on 4G’s control plane results in the exchange of additional signaling messages between eNB and gNB that leads to longer HO duration.
总体而言,上述分解凸显了5G切换所包含的复杂性。特别是在NSA架构中,5G对4G控制面的依赖导致了eNB与gNB之间需要交换额外的信令消息,进而延长了切换的持续时间。
5.3 Handover Energy Consumption¶
We quantify the energy overhead for NSA 5G HOs and compare our results with 4G HOs. We use 5G Tracker, XCAL, and Monsoon Power Monitor (MPM) introduced in §2 to conduct drive tests in areas with OpX NSA 5G (low-band and mmWave) and LTE coverage. Here, we focus on NSA HOs that bear higher HO frequency and in general smaller cell coverage compared to SA HOs.
Data Collection Methodology. To precisely calculate the energy consumption of HOs, ideally we need two pieces of data: (i) lowerlayer measurement events, reports, and HOs information that can be precisely obtained from XCAL, and (ii) the actual power readings during HOs. We use MPM to profile the power consumption of a high-end smartphone (Samsung Galaxy S20 Ultra 5G). A practical challenge is that XCAL and MPM cannot be used simultaneously as the smartphone will draw current from the tethered XCAL laptop, making the MPM’s power reading meaningless. To address this challenge, we first survey 42 km+ using XCAL to identify spots where a HO is triggered repeatedly by a single measurement event. Then, we drive 6 loops around identified spots with 5G Tracker and XCAL to establish the ground-truth of HOs. Specifically, we verify that the HO, radio technology, and band information reported by 5G Tracker’s Android APIs is exactly same as XCAL data. Finally, we drive 10 loops with 5G Tracker (which does not require laptop tethering) and MPM to collect HO power measurements. To keep the UE in RRC connected state [10], we send a 32-byte ping packet every 5 seconds 2 . To exclude the ping transmission power, we take a +1s window starting from the time when a ping packet was transmitted and remove the corresponding measurements. We set the phone brightness to 25% for consistency and subtract baseline power from the total when presenting results. The baseline power is calculated when there is no HO and the UE is stationary. The transmission power of PING packets is also subtracted.
HO Energy Results. We calculate the battery drain for a typical smartphone using NSA 5G low-band. We find that a smartphone traveling at 130 km/h for 1 hour can witness on average 553 5G HOs. This will result in ∼34.7 mAh energy drain. 4G HOs, on the other hand, only consume ∼3.4 mAh energy. Similarly, NSA mmWave can experience 998 HOs and drain ∼81.7 mAh energy using the same settings.
Intuition suggests that when the device is in RRC connected state [10] (transmitting or receiving data), the data-plane energy consumption overwhelms the control-plane (HO) energy, but our experiments tell a different story for commercial 5G. We compare the HO energy consumption with the data-plane energy consumption. Narayanan et al. [54] present the power consumption per byte for the same smartphone model as ours i.e., S20U. In particular, we use the slopes of Throughput-Power curves presented in Table 8 of Narayanan et al.’s [54] work. We find that S20U using NSA low-band can download ∼4.3 GB data (or upload ∼2.0 GB data) with 34.7 mAh worth of battery capacity. Likewise, NSA mmWave can download ∼75.4 GB data (or upload ∼14.5 GB data) using 81.7 mAh energy. These results indicate the non-trivial energy footprint for 5G HOs, in particular small form-factor devices such embedded IoT devices that relatively have lesser and limited power resources.
Fig. 10 provides further details of our HO energy experiments. The figure shows two metrics: (i) the power consumption of a single HO (left y-axis), and (ii) the energy consumption per unit distance (right y-axis). To compute energy per-unit distance, we take into account the frequency of HOs measured in §5.1. We separately plot the HO power consumption of 4G/LTE mid-band (left), NSA low-band (middle), and NSA mmWave (right). As shown in Fig. 10, HOs in NSA 5G consume 1.2-2.3× more energy when compared to HOs in 4G/LTE. The HO energy consumption is higher for NSA 5G HOs because both 4G and 5G radio are involved in the HO process. Surprisingly, a single mmWave HO in NSA 5G is 54% more energy efficient than a single low-band HO. This is likely because the improved RACH procedure in mmWave [7] results in lower HO energy consumption. Despite this, since HOs are highly frequent in NSA mmWave bands (§5.1), they cumulatively incur a greater energy footprint. For instance, we find that NSA mmWave HOs result in 1.9-2.4× more energy consumption per-unit distance compared to low-band HOs.
切换能耗:5G切换对手机电池的消耗极其显著。
- 在130公里/小时的时速下行驶1小时
- NSA低频段的切换会消耗约34.7 mAh电量(原本足以支撑数GB的数据传输)
- 4G仅消耗3.4 mAh
- 毫米波段的切换电量消耗更是高达81.7 mAh
- 单次NSA 5G切换的能耗是4G的1.2到2.3倍
- 有趣的是,尽管单次毫米波切换比低频段切换节能54%,但由于其极高的切换频率,毫米波在单位距离上的整体能耗反而是低频段的1.9到2.4倍
Implications of 5G Handovers on Carriers¶
主要从网络侧的视角分析了现有5G部署中的缺陷,并为运营商提出了潜在的优化方向。
其核心内容可概括为以下三点:
-
5G小区的实际覆盖全景与NSA架构导致的“覆盖缩水”:
- 测量显示,NSA 5G的平均小区覆盖直径在低频、中频和毫米波段分别为1.4公里、0.73公里和0.15公里
- 核心痛点:
- 在低频 NSA 5G 中,虽然 5G 数据面 走覆盖广的低频段,但其绑定的 4G 控制面 走的是覆盖较窄的中频段
- 因为 4G 控制面的切换必然会强制触发 5G 切换,这导致低频 5G 的实际有效覆盖距离大幅缩水(相比纯5G SA模式缩小了1.2至2倍)
-
5G基站间切换对网络带宽的负面影响:
- 通常切换是为了寻找更好的信号以提升吞吐量,但研究发现: 在NSA架构下,两个5G基站间的切换(SCGC)往往适得其反,导致切换后的带宽中位数下降了14%
- 核心痛点:NSA 5G不支持两个5G基站(gNB)之间直接切换,设备必须先执行“5G退回到4G”,然后再执行“4G连接到新5G”的两次独立切换
- 由于缺乏全局(5G到5G)的信号强度优化考量,经常导致切换后网速不升反降
-
4G与5G基站共址(Co-location)对切换时长的影响:
- 在NSA网络中,手机需要同时连接4G基站(eNB)和5G基站(gNB),但它们往往不在同一个物理铁塔上(数据中低频共址率仅为5%-36%)
- 核心痛点与优化提示:
- 当4G和5G基站共址(PCI相同)时,由于避免了基站间的跨塔通信延迟,其切换持续时间会显著缩短,平均节省13毫秒
- 这提示NSA运营商在制定切换决策时,应充分考虑4G/5G天线的物理位置关系
4G/5G Handover Prediction¶
详细介绍了研究团队开发的切换预测系统 Prognos 的设计、评估与应用落地。其核心内容可概括为以下四个方面:
-
挑战与设计目标:
- 由于各家运营商的切换(HO)逻辑是高度定制化的“黑盒”策略,依赖离线训练的模型难以泛化
- 为此,团队旨在构建一个轻量级、可扩展、且具有解释性的在线增量学习切换预测系统(Prognos)
-
Prognos 系统的三阶段架构设计:
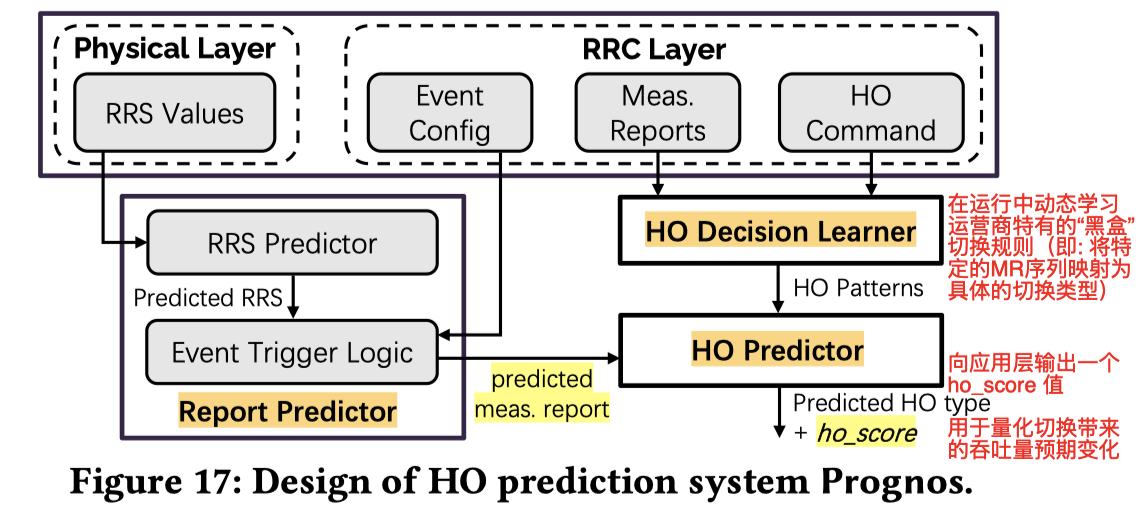
- 测量报告预测器 (Report Predictor):
- 利用轻量级的线性回归模型预测未来的信号强度(RRS),从而: 在底层真正生成报告前,提前预测出用户设备(UE)即将上报的测量报告(MR)
- 决策学习器 (Decision Learner):
- 引入序列模式挖掘算法(基于修改的 prefixSpan),在运行中动态学习运营商特有的“黑盒”切换规则(即将特定的MR序列映射为具体的切换类型)
- 切换预测器 (Handover Predictor):
- 将预测出的MR序列与学习到的规则模式进行匹配以预测切换类型
- 并向应用层输出一个
ho_score值,用于量化切换带来的网络吞吐量预期变化
-
性能评估与优势:
- 通过将“底层信号推理”与“网络侧决策逻辑学习”解耦,Prognos 极大降低了模型复杂度并排除了无关特征的干扰
- 相比于 Gradient Boosting Classifier (GBC) 和 Stacked LSTM 等传统的“盲目”机器学习端到端预测方法,Prognos 在无需离线训练的情况下,F1分数高达0.92-0.94,准确率和召回率均实现了成倍的碾压级提升(见 Table 3)
- 借助报告预测器,Prognos 平均能将切换的预测时间提前931毫秒,为上层应用留出了充足的应对窗口
-
应用层优化案例验证 (Use Cases):
- 通过将 Prognos 的
ho_score整合进应用的自适应码率(ABR)算法中修正吞吐量预测,研究验证了其对两款高带宽应用的QoE提升效果: 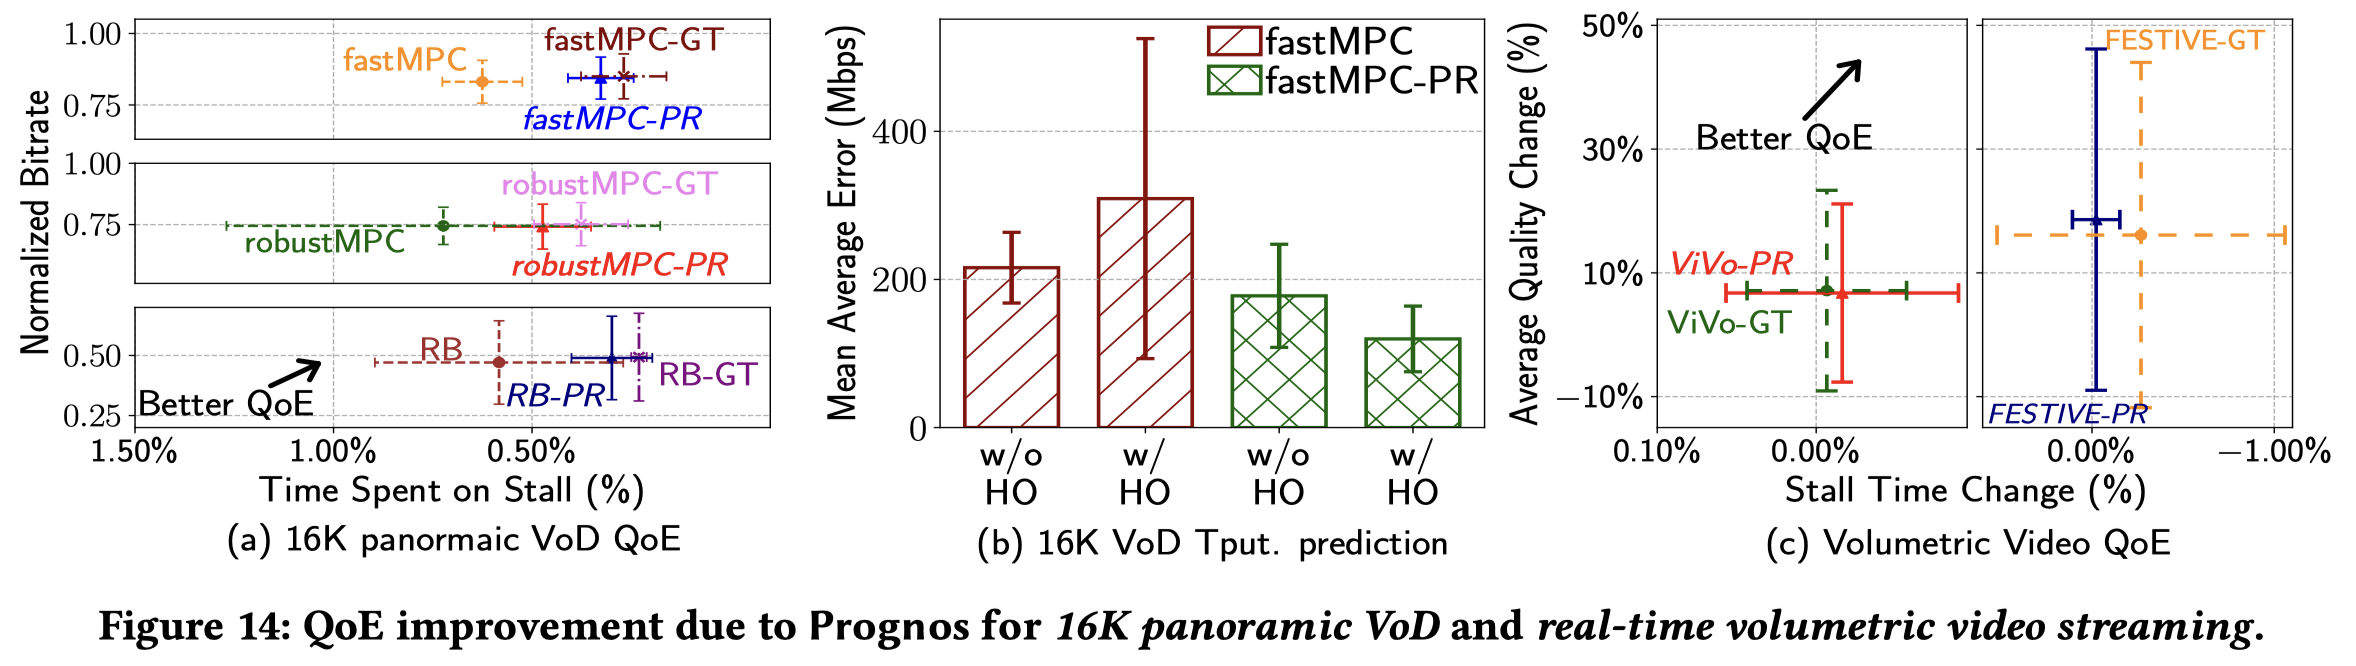
- 16K全景视频点播:
- 使ABR算法的吞吐量预测误差大幅缩小(如 Fig. 14b 所示)
- 并在不牺牲画质的情况下减少了34.6%-58.6%的卡顿时间(如 Fig. 14a 所示)
- 实时体积视频流:
- 在有效控制卡顿的前提下,使画面质量提升了15.1%-36.2%(如 Fig. 14c 所示)
- 通过将 Prognos 的
In this section, we first introduce the HO prediction problem for cellular networks (LTE/5G). We then discuss the design of our system (Prognos) along with an overview of its components. As part of the evaluation, we compare the performance of Prognos against two existing approaches. Finally, we show the advantage of utilizing HO predictions for two mobile applications: 16K panoramic video-on-demand (VoD) and real-time volumetric video streaming.
7.1 Challenges and Goals
The design of Prognos is inspired by practical mobility management concerns. The “black-box” policy-based HO logic employed by cellular carriers (e.g., to choose a target cell for HO) depends on the carrier’s deployment strategy for a geographical area. Moreover, the HO policies can change from one geographical region to another depending on the carrier’s goal. On the other hand, we observe low temporal variation in HO policies for our collected data. In general, these insights confirm previous LTE studies [37]. Finally, the policybased HO logic is unique for each HO type and can be formulated as a sequence of measurement reports (MRs) preceding a HO. For example, [𝐴2,𝐴5, 𝐿𝑇𝐸𝐻 𝑖𝑛𝑡𝑒𝑟 ] translates to an A2 MR followed by an A5 MR that eventually triggered an LTE inter-frequency HO. The trigger of MRs, in the first place, depends on mobility configurations and signal strength values of serving and neighboring cells.
We seek to overcome these challenges and build a system that can learn such carrier-specific HO policies. More specifically, our goal is to build a light-weight, scalable, context-aware, and explainable system for HO prediction. An explainable system can help understand the “black-box” nature of HO policies and apply sanity checks during prediction process. A transferable scheme can help the system scale well by enabling us to transfer models with similar geographic properties and/or carrier’s deployment strategies. Any solution involving offline training will rely on the collected dataset to learn HO policies and may not generalize to the unseen mobility scenarios. A light-weight system avoids unnecessary overhead of real-time prediction on energy-constrained mobile devices. As the UE moves, a reactive system must respond to the changing radio environment. In addition to predicting HOs, a context-aware approach can consider factors such as radio access technology (LTE, 5G) and bands to inform applications about the possible improvement or deterioration of network conditions in future.
We realize our goal and its design principles by adopting an incremental learning scheme that extends system’s knowledge as more data arrives. Compared to offline training, our approach is more adaptive. Prognos adapts to all mobility scenarios, geographic locations, and cellular carriers. The HO logic learned by Prognos sheds light on carrier-specific HO decisions. It also facilitates sanity checks during prediction, and reduction of action space. For example, an SCGM HO prediction cannot be made when a device is using LTE. Finally, Prognos outputs a meaningful value ℎ𝑜_𝑠𝑐𝑜𝑟𝑒 for applications, which specifies the expected change in network capacity due to HO. We leverage the domain knowledge of cellular networks to design a system that predicts all HO types.
7.1 挑战与目标
Prognos 的设计灵感源于实际的移动性管理问题。蜂窝运营商所采用的基于策略的“黑盒”切换逻辑(例如,用于选择切换的目标小区)取决于运营商在特定地理区域的部署策略。此外,切换策略可能会因运营商的目标不同而发生跨区域的变化。另一方面,在我们收集的数据中,我们观察到切换策略的时间变化较小。总体而言,这些见解印证了先前有关 LTE 的研究 [37]。
最后,基于策略的切换逻辑对于每种切换类型都是独一无二的,并且可以公式化为切换发生前的一系列测量报告(MR)序列。例如,\([A2, A5, LTEH_{inter}]\) 转化为: 一个 A2 测量报告,随后是一个 A5 测量报告,最终触发了 LTE 异频切换。
首先,测量报告的触发取决于移动性配置以及服务小区和邻区的信号强度值。
我们试图克服这些挑战,并构建一个能够学习此类运营商特定切换策略的系统。更具体地说,我们的目标是构建一个轻量级、可扩展、感知上下文且具有解释性的切换预测系统。具有解释性的系统有助于理解切换策略的“黑盒”本质,并在预测过程中应用合理性检查。可迁移的方案通过使我们能够迁移具有相似地理特征和/或运营商部署策略的模型,从而帮助系统实现良好的扩展性。任何涉及离线训练的解决方案都将依赖于收集的数据集来学习切换策略,并且可能无法泛化到未见的移动性场景。轻量级系统避免了在能量受限的移动设备上进行实时预测时不必要的开销。随着用户设备(UE)的移动,响应式系统必须对不断变化的无线电环境做出反应。除了预测切换之外,感知上下文的方法还可以考虑无线电接入技术(LTE、5G)和频段等因素,以向应用程序通报未来网络条件可能改善或恶化的情况。
我们通过采用增量学习方案来实现我们的目标及其设计原则,该方案随着更多数据的到达不断扩展系统的知识。与离线训练相比,我们的方法更具适应性。Prognos 能够适应所有的移动性场景、地理位置和蜂窝运营商。Prognos 学习到的切换逻辑阐明了运营商特定的切换决策。它还促进了预测期间的合理性检查,并减少了动作空间。例如,当设备使用 LTE 时,无法做出 SCGM 切换预测。最后,Prognos 会为应用程序输出一个有意义的 ho_score 值,该值指定了由于切换引起的预期网络容量变化。我们利用蜂窝网络的领域知识来设计一个能够预测所有切换类型的系统。
7.2 Design
Prognos is a holistic system for HO prediction and provides meaningful information about network fluctuations caused by HOs. The system consists of three key components (see Fig. 17 in Appendix A.4). The report predictor module considers mobility configurations and signal strength qualities to predict MRs. The decision learner module learns the carrier-specific HO decision logic by leveraging ideas from sequential pattern mining. Finally, the handover predictor module uses the sequence of predicted MRs and learned HO logic to forecast the HO type.
Measurement Report Prediction. Using MRs after they have been triggered only leaves a few milliseconds – 70 ms in the median case – for the application to take any decision proactively. Therefore, report predictor helps predict the HOs earlier while leaving enough time for applications to minimize QoE degradation during HO. To decide if a measurement event will be triggered and reported to the serving cell, we observe three factors: (i) configurations (threshold, time-to-trigger (𝑇𝑇𝑇) etc.) received from the serving cell for a measurement event, (ii) predicted RRS of serving cell, and (iii) predicted RRS of neighbor cell. To predict the RRS of serving and neighbor cells in next prediction window, the RRS values in the last history window are fed into a linear regression model, which is lightweight. A triangular kernel-based method [46] is used for signal smoothing in order to eliminate the variations caused by small scale fading and measurement noise. Based on the configurations received from the serving cell and predicted RRS, we forecast if the triggering condition 4 of an event will be satisfied in next prediction window or not. If a triggering condition is met for 𝑇𝑇𝑇 amount of time, the report predictor module sends this prediction to the handover predictor module.
Policy-based Handover Logic Learning. The decision learner learns the up-to-date HO logic employed by the carrier. The input for decision learner module is a continuous stream of MRs and HO commands delivered on the RRC layer. We split the input stream into phases — each 𝑝 ℎ𝑎𝑠𝑒 consists of MR(s) followed by a HO command. In Prognos, we call the learned decision logic a pattern which is a unique sequence of MRs repeatedly triggering a specific type of HO. The goal of the HO decision learning algorithm is to learn up-to-date patterns for each HO type. This sequence-based formulation of HO decision logic takes motivation from sequential pattern mining [33]. We make modifications to prefixSpan algorithm [58] making it learn patterns in an online fashion. At the end of each phase, the online learning algorithm may decide to take one of the following two actions; (i) increment the support count 5 of a pattern if an old sequence is observed or (ii) add a pattern if a new sequence is encountered. The algorithm evicts old patterns according to a freshness threshold as well. Here, freshness simply means how recent a pattern was. The eviction process also makes sure that the number of learned HO patterns do not grow excessively. Finally, the 𝑝 ℎ𝑎𝑠𝑒 𝑐𝑜𝑢𝑛𝑡 is incremented, and we wait for a new HO to process the next 𝑝 ℎ𝑎𝑠𝑒.
Handover Prediction. To predict the HO, we consider the sequence of predicted MRs received so far in the current 𝑝 ℎ𝑎𝑠𝑒. This predicted sequence is matched against all the learned HO patterns sent by decision learner. If no pattern is found among the candidates, a “no HO” prediction is made by the handover predictor. Otherwise, the HO type is predicted based on the pattern which has the highest similarity. The similarity of a pattern is a function of its support count, length and freshness. Finally, based on the predicted HO type and current radio technology, Prognos generates a ℎ𝑜_𝑠𝑐𝑜𝑟𝑒 ∈ (0, ∞). This value represents expected improvement or degradation in throughput (e.g., ℎ𝑜_𝑠𝑐𝑜𝑟𝑒=0.4 indicates 60% degradation in throughput, while a score of 1 indicates no HO or no degradation). It is empirically calculated from results reported in Fig. 16. Specifically, we calculate the median change in network capacity using the ratio of throughput before and after HO. Most of time, ℎ𝑜_𝑠𝑐𝑜𝑟𝑒 is 1, representing “no HO”, thus no expected change in throughput due to HO.
7.2 设计
Prognos 是一个用于切换预测的整体系统,并提供有关由切换引起的网络波动的有意义信息。该系统由三个关键组件组成:
- 报告预测器(report predictor)模块:综合考虑移动性配置和信号强度质量来预测测量报告(MR)
- 决策学习器(decision learner)模块:借鉴序列模式挖掘的思想,学习运营商特定的切换决策逻辑
- 最后,切换预测器(handover predictor)模块利用预测的 MR 序列和学习到的切换逻辑来预测切换类型
测量报告预测 (Measurement Report Prediction)。 在测量报告(MR)触发后才使用它们,仅能为应用程序留下几毫秒(中位数情况下为 70 毫秒)的时间来主动做出任何决策。因此,报告预测器有助于更早地预测切换,同时为应用程序留下充足的时间,以尽量减少切换期间 QoE(体验质量)的下降。
为了决定是否会触发测量事件并将其报告给服务小区,我们观察三个因素:
(i) 从服务小区接收到的针对某个测量事件的配置(如阈值、触发时间 (TTT) 等)
(ii) 服务小区的预测 RRS
(iii) 邻区的预测 RRS
为了预测下一个预测窗口中服务小区和邻区的 RRS,过去历史窗口中的 RRS 值会被输入到一个轻量级的线性回归模型中。采用基于三角核的方法 [46] 进行信号平滑,以消除由小尺度衰落和测量噪声引起的波动。基于从服务小区接收到的配置和预测的 RRS,我们预测在下一个预测窗口中某个事件的触发条件是否会得到满足。如果触发条件在 TTT 时间内得到满足,报告预测器模块便会将此预测发送给切换预测器模块。
基于策略的切换逻辑学习 (Policy-based Handover Logic Learning)。 决策学习器负责学习运营商所采用的最新切换逻辑。决策学习器模块的输入是 RRC 层上传递的连续的测量报告(MR)和切换命令流。
我们将输入流划分为多个阶段(phases): 每个阶段包含一个或多个 MR,随后跟着一个切换命令
在 Prognos 中,我们将学习到的决策逻辑称为一种模式(pattern),它是一个重复触发特定类型切换的独特 MR 序列。切换决策学习算法的目标是为每种切换类型学习最新的模式。
这种基于序列的切换决策逻辑公式化方法受到序列模式挖掘 [33] 的启发。我们对 prefixSpan 算法 [58] 进行了修改,使其能够以在线方式学习模式。
在每个阶段结束时,在线学习算法可能会决定采取以下两个操作之一:
(i) 如果观察到旧序列,则增加模式的支持度计数
(ii) 如果遇到新序列,则添加一个新模式
该算法还会根据新鲜度(freshness)阈值驱逐旧模式。在这里,新鲜度仅仅意味着一个模式有多近才被观察到。驱逐过程还确保学习到的切换模式数量不会过度增长。最后,阶段计数增加,我们等待新的切换以处理下一个阶段。
切换预测 (Handover Prediction)。 为了预测切换,我们考虑当前阶段中迄今为止接收到的预测 MR 序列。将该预测序列与决策学习器发送的所有已学习的切换模式进行匹配:
- 如果在候选模式中未找到匹配项,则切换预测器做出“无切换”的预测
- 否则,将基于相似度最高的模式预测切换类型
模式的相似度是其支持度计数、长度和新鲜度的函数。
最后,基于预测的切换类型和当前的无线电技术: Prognos 生成一个 ho_score ∈ (0, ∞)。该值代表吞吐量的预期改善或恶化(例如,ho_score = 0.4 表示吞吐量下降 60%,而得分为 1 表示无切换或无恶化)。
它是根据图 16 中报告的结果通过经验计算得出的。
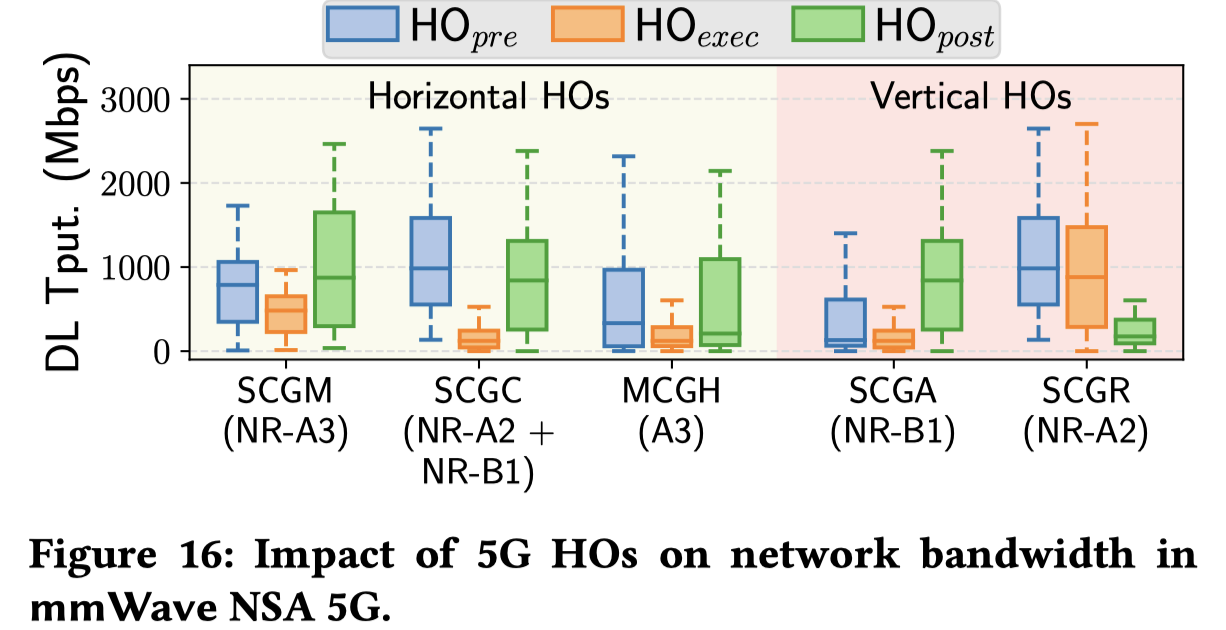
具体而言,我们使用切换前后吞吐量的比率来计算网络容量的中位数变化。在大多数情况下,ho_score 为 1,代表“无切换”,因此预期不会因切换而发生吞吐量变化。
Related Work¶
| 文献/研究者 | 网络环境 | 研究焦点与核心贡献 | 存在的局限性 (本文指出) |
|---|---|---|---|
| Li et al. [45] | LTE/4G | 观察到实际蜂窝网络中持续存在的切换(HO)循环,并提供了识别这种持续不稳定性的方法。 | 仅局限于 4G/LTE 网络,未涉及 5G。 |
| Deng et al. [37] | 2G/3G/LTE | 对网络进行了大规模的HO分析,验证了运营商部署的HO配置的复杂性与多样性。 | 仅局限于 2G/3G/4G 时代。 |
| [43] | 3G/4G | 通过分析信令消息和底层网络信息,研究了移动网络中移动性管理的不稳定性。 | 仅局限于 3G/4G 时代。 |
| Xu et al. [65] | 5G (Sub-6 GHz) | 重点研究了 Sub-6 GHz 频段的 5G,揭示了切换对无线电信号强度和 TCP 吞吐量的影响。 | 缺乏对能效和应用体验质量 (QoE) 的深入探讨。 |
| Narayanan et al. [53] | 5G (毫米波) | 对两家商业 5G 运营商的毫米波(mmWave)部署进行了基于测量的分析。 | 缺乏对能效和应用体验质量 (QoE) 的深入探讨。 |
| [38, 42] | 3G/LTE | 利用用户的移动模式,开发了简单的切换预测技术。 | 未证明其预测方案在真实世界应用中的可用性。 |
| Ozturk et al. [57] | 蜂窝网络 | 利用时间相关性,进行了基于位置的切换预测。 | 未证明其预测方案在真实世界应用中的可用性。 |
| Mei et al. [49] | 蜂窝网络 | 采用梯度提升分类器(GBC)方法,利用底层信息来预测切换。 | 未证明其预测方案在真实世界应用中的可用性。 |
| 本文 (Our Work) | 5G | 针对 5G 移动性管理进行了更全面的测量研究,深入剖析了切换对设备能效和应用 QoE 的影响;设计了切换预测系统,并通过两个实际应用案例证明了其预测方案在现实世界中的有效性。 | - |
Discussion¶
-
测量范围的局限性:
- 受限于对运营商网络的可见性,本研究未能探讨不同基站设备供应商之间的差异
- 此外,尽管研究团队通过在不同时间和地点(包括夜间)进行测试来尽量降低网络拥堵带来的干扰,但由于5G切换更加频繁,诸如移动速度和基站密度等因素对体验质量(QoE)和能耗的影响相比4G会进一步放大
-
研究结果对未来5G及后续技术的适用性:
- 目前的5G基础设施仍在成熟中(多为依赖4G控制面的NSA部署)
- 随着网络向SA模式或演进版NSA(如使用5G核心网的Option 4)过渡,本研究的发现依然适用
- 此外,Prognos预测系统支持所有的4G和5G切换类型,因此能够为未来网络演进(甚至5G向6G过渡)提供持续的价值
-
系统启动阶段的预测延迟与优化:
- Prognos系统在实时学习新模式的启动初期,因缺乏足够的历史数据,预测准确率(F1分数)通常较低
- 研究提出,通过使用数据集中最频繁的切换模式对系统进行引导(Bootstrapping),可以在极短时间内(约1.5分钟)将F1分数迅速拉升至0.8以上
-
未来5G对跨层通信接口的需求:
- 当前获取网络底层(如物理层和RRC层)的信令信息高度依赖专业的外部测试工具
- USRP-based control channel decoders [64]
- Accuver XCAL [15]
- MobileInsight [44]
- Mobilyzer [56]
- LiveLab [62]
- 研究呼吁,未来的5G多接入边缘计算(MEC)或手机操作系统(如Android API)应向应用层开放底层的无线电网络信息,这将极大助力上层应用在吞吐量预测、丢包恢复和能耗建模等方面的自我优化
- 当前获取网络底层(如物理层和RRC层)的信令信息高度依赖专业的外部测试工具
Conclusion¶
We have carried out a first comprehensive measurement study that uncovers 5G mobility management. We conduct extensive drive tests for 6,200 km+, covering both urban and rural areas in the U.S. Our measurement findings offer deep insights into the performance, energy, cross-technology impact, upper-layer implications, and operational issues of 5G HOs. We design a holistic HO prediction system to improve application QoE during mobility. Our research also identifies key research directions on improving 5G mobility management. We have released our datasets to the research community.