CCEval: Accurately and Confidently Evaluating Performance Metrics of Congestion Control Algorithms for Datacenter Networks¶
这篇论文提出了一套名为 CCEval 的评估框架,专门旨在准确且高置信度地评估数据中心网络(DCN)中拥塞控制算法(CCA)的性能指标。
TLDR¶
现有评估痛点¶
- 在现有的 DCN CCA 评估工作流中,流量负载的随机性会带来极大的系统可变性
- 大多数现有研究使用的实验测试次数极少(通常不超过10次),导致无法提供足够的统计置信度
- 作者调查了20篇近期高引用的顶级会议 CCA 论文,发现:
- 高达85%的研究完全没有报告误差范围或具体的实验次数
- 这可能导致得出具有误导性的结论
CCEval的核心技术¶
为了解决上述问题,CCEval 提出了两种创新的估计算法:
- 无模型估计算法 (Model-free estimation algorithm):
- 该方法基于 独立同分布特性 并利用 蒙特卡洛方法 来构建性能指标的置信区间
- 它适用于任何 CCA 和性能指标,并且能够针对目标精度和置信水平提前预测所需的实验次数
- 基于模型的尾部分位数估计算法 (Model-based tail quantile estimation algorithm):
- 针对难以捕捉的尾部性能(如长尾延迟),该算法引入了 重要性采样(Importance Sampling, IS)技术,使得导致长尾性能的罕见事件发生概率增加
- 此外,它还使用 自适应交叉熵算法 来高效搜索近似最优的 IS 分布,从而在保证精度和置信度的前提下显著降低所需的实验次数
实验结果与贡献¶
- 研究团队在 NS-3 等模拟器以及真实世界的硬件测试床上,对四种广泛使用的 CCA(DCTCP、DCQCN、TIMELY 和 HPCC)进行了广泛的实验验证
- 实验表明,CCEval 能够稳定地以 1% 的相对误差和 95% 的置信水平生成性能指标的准确估计
- 在使用基于模型的估计算法时,评估尾部性能所需的实验次数大幅减少了 75% 至 80%
Introduction¶
(1) 研究背景与典型评估流程
-
背景:
- 数据中心网络(DCN)的拥塞控制算法(CCA)是当前非常活跃的研究领域,研究人员需要确保新算法能够在各种网络场景下与现有算法进行公平且可靠的比较
-
典型评估流程:
- 生成实验配置(网络、CCA参数、工作负载)
- 执行多次 CCA 实验(通过采样流量分布)
- 计算多次试验结果的统计数据来估计性能指标
(2) 现有评估方法的严重缺陷 (Our Motivation)
-
缺乏统计严谨性:
- 作者调查了20篇近期的高被引顶会论文,发现高达85%的论文完全没有报告误差范围或实验次数
- 其余的也大多仅基于极少量的实验(≤10次)
-
导致误导性结论:
- 由于流量工作负载的随机性会带来极大的性能方差,少数几次实验可能得出完全相反的结论
- 例如,仅做10次实验时 HPCC 的表现不如 DCQCN,但当实验次数增加到500次时,结论却完全反转
(3) 理想评估框架的四大需求
必须满足以下四个条件:
- R1:能够量化实验结果的准确性(置信区间/误差范围)和置信度(包含真实统计数据的概率)
- R2:能够针对给定的置信区间和置信水平,提前预测所需的实验次数,以合理分配资源
- R3:具备通用性,适用于任何 CCA,不需要了解算法细节或进行手动建模
- R4:在不牺牲准确性和置信度的前提下,显著减少所需的实验次数,从而降低漫长的实验时间
(4) 核心解决方案:CCEval 框架
为了满足上述需求,本文提出了 CCEval 框架,主要包含以下核心贡献:
- 置信区间量化 (对应R1):
- 明确通过计算性能指标的置信区间来量化误差和置信度。
- 无模型估计算法 (对应R2, R3):
- 利用多次实验独立同分布(IID)的特性和蒙特卡洛方法,构建无模型估计算法。
- 该方法不仅适用于任何 CCA,还能利用少量初始实验来准确预测后续所需的总实验次数。
- 基于模型的尾部分位数估计算法 (对应R4):
- 针对长尾性能事件(罕见事件),引入了重要性采样(Importance Sampling, IS)技术
- 以增加罕见事件发生的概率。
- 同时提出了一种自适应交叉熵算法来高效搜索近似最优的 IS 分布,从而用更少的实验次数达到同样的精度。
- 实验效果:
- 在模拟器和真实测试床上的广泛实验表明,CCEval 能够以 1% 的相对误差和 95% 的置信水平实现精确评估,并在尾部指标估计上将实验次数减少 75%~80%
Background and Motivation¶
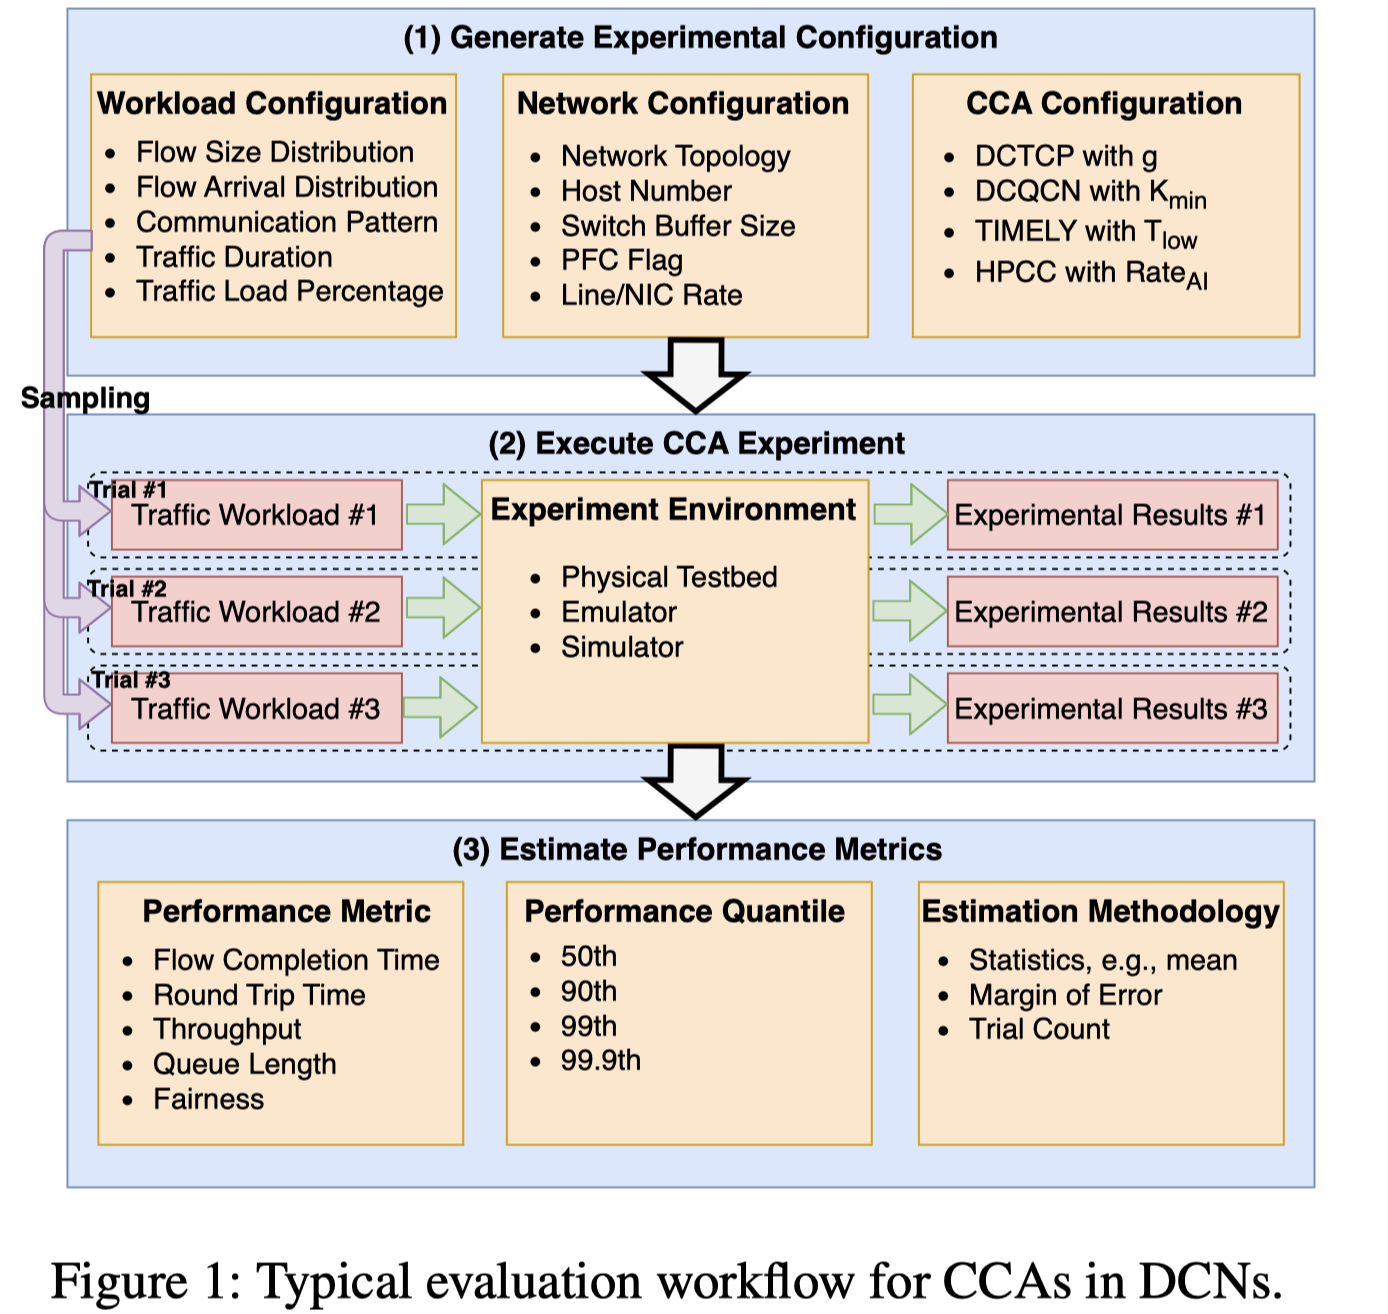
(1) Typical CCA Evaluation Workflow
-
步骤一: 生成实验配置
- 工作负载配置(如: 流大小和到达分布)
- 网络配置(如: 拓扑、缓冲区大小)
- 具体的 CCA 参数配置
-
步骤二: 执行 CCA 实验
- 研究人员会从流量分布中重复采样以获取工作负载 Trace
- 并在物理测试床、仿真器或模拟器上执行这些单次 "试验"(Trial)
-
步骤三: 估计性能指标
- 收集所有试验的结果,并通过计算统计数据(如: 所有试验中特定分位数的均值)来估计最终的性能指标
(2) 近期 CCA 评估中存在的置信度问题
作者指出,由于无法测试所有可能的流量工作负载,实验结果必然存在误差,但当前的评估方法往往忽视了这一点:
文献调研的不足:
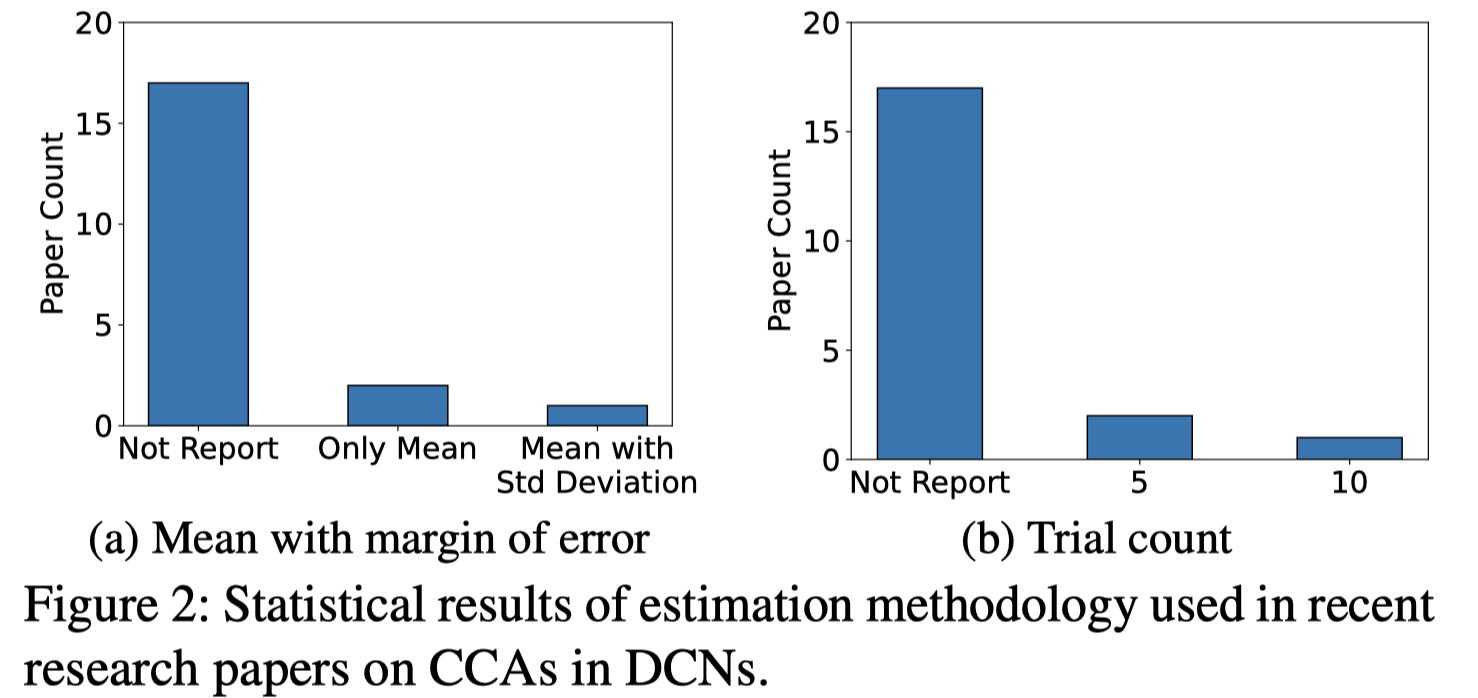
- 作者调查了20篇近期顶级会议中的高被引 CCA 论文,发现 85% 的论文完全没有报告误差范围或实验次数
- 即便报告了实验次数的研究,其进行的试验次数也极其有限(通常仅为5次或10次)
实验观察到的误导性结论:
- 作者复现实验后发现,由于系统本身的方差(如流量随机性),性能指标不可避免地存在巨大波动,标准差有时甚至高达均值的 50%
- 极少的实验次数会导致极低的置信度,从而产生误导性结论
如图:
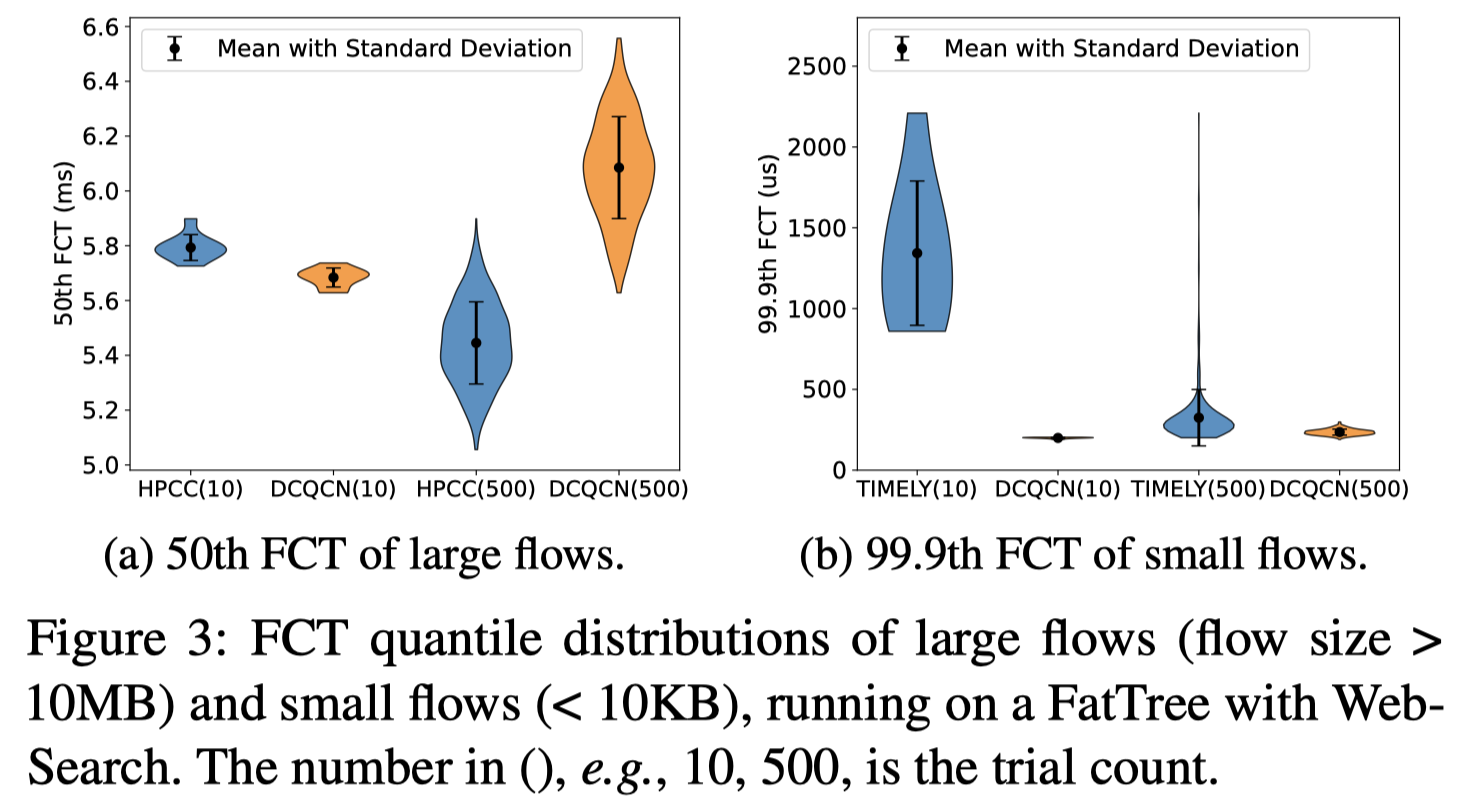
- 在仅进行 10 次试验时,HPCC 的中位数流完成时间(FCT)看起来比 DCQCN 更差
- 当试验增加到 500 次时,结论却完全反转(HPCC 优于 DCQCN)
(3) Requirements for Confident Estimation
基于上述痛点,作者提出了一个能够有高置信度且准确评估 CCA 的理想框架必须满足的四大需求:
- R1:量化准确性与置信度
- 框架应明确使用置信区间(Confidence Intervals)而非简单的标准差来量化实验误差和置信水平
- R2:预测所需的试验次数
- 框架应能在给定目标精度和置信水平的前提下,提前预测完成评估所需的试验次数,以便研究人员合理规划资源
- R3:具备广泛的泛化能力
- 框架必须适用于任何拥塞控制算法,无需了解算法内部细节或为新算法手动建立数学模型
- R4:在保障精度的同时减少试验次数
- 由于准确评估通常需要海量的试验次数(耗时极长),框架应能在不牺牲精度和置信度的前提下,大幅减少实际所需的试验次数
System Overview¶
Figure 5 shows the architecture and workflow of CCEval.
Input & output. CCEval takes two configurations as input. The first is an experimental configuration identical to current evaluation workflows as described in §2.1. The second is the estimation configuration introduced by CCEval, including the performance metric with the corresponding quantile, the required accuracy, and the target confidence level. Based on these inputs, the output is the estimated mean and confidence interval for the performance metrics.
Main components and workflow. As shown in Figure 5, CCEval contains three main components:
- A traffic distribution sampler.
- An experiment executor.
- A performance metric estimator.
The traffic distribution sampler samples new traffic workloads from the traffic distribution. The experiment executor executes trials based on the experiment configuration and generates experimental results. The experiment executor can be executed on physical testbeds, simulators [15,25,38], or emulators [31]. Based on the results of the cumulative trials up to that point, the performance metric estimator executes the estimation algorithm and calculates the confidence interval for all of the target performance metrics.
If, after the current iteration, the required accuracy or confidence level is not met, CCEval repeats the process and goes back to step (1). After only a few such iterations (default of 20), the system is able to output an estimate of the remaining number of trials until convergence with very high accuracy, following the technique described in §4.2. When the target confidence level is met, the system terminates and outputs the desired metrics.
图 5 展示了 CCEval 的架构与工作流:
输入与输出:
CCEval 接收两种配置作为输入.
第一种是实验配置,这与 §2.1 节中描述的当前评估工作流完全一致
第二种是 CCEval 引入的估计配置,其中包含目标性能指标及其相应的分位数、所需的准确度以及目标置信水平
基于这些输入,其输出结果为性能指标的估计均值及置信区间
主要组件与工作流:
如图 5 所示,CCEval 包含三个核心组件:
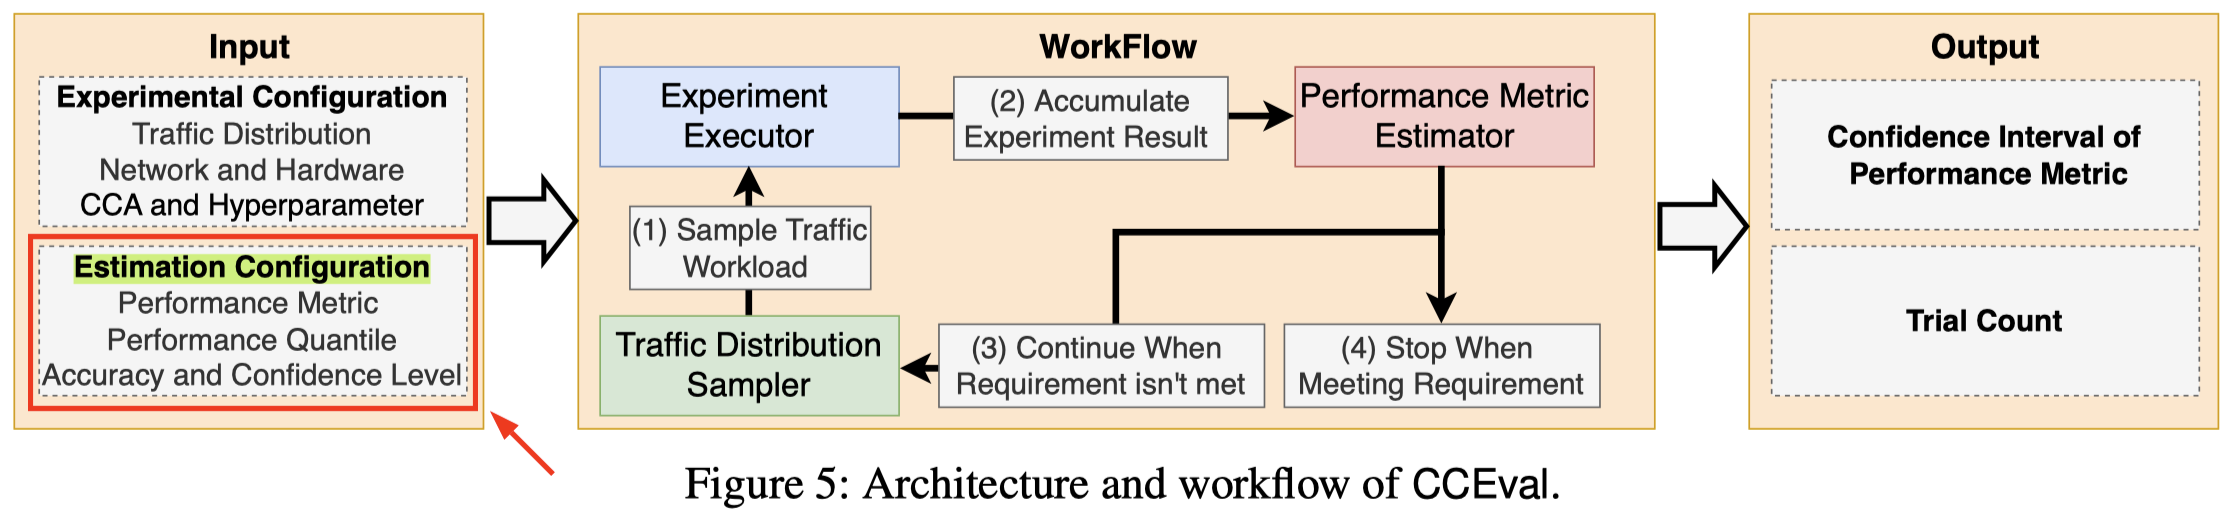
- 流量分布采样器 (Traffic distribution sampler)
- 从流量分布中采样生成新的流量工作负载
- 实验执行器 (Experiment executor)
- 可以部署在物理测试床、网络模拟器 [15,25,38] 或网络仿真器 [31] 上运行
- 性能指标估计器 (Performance metric estimator)
- 基于截至当前所有累计试验的结果,运行估计算法并计算出所有目标性能指标的置信区间
如果在当前迭代之后,未能满足所需的准确度或置信水平,CCEval 将重复上述过程并返回至步骤 (1)
仅仅经过少量迭代(默认设定为20次)后,系统即可遵循 §4.2 节中描述的技术,以极高的准确度输出达到收敛状态所需的剩余试验次数估计值
当达到目标置信水平时,系统即终止运行并输出所需的性能指标
Evaluation¶
Experimental Methodology
Infrastructure and testbed. We evaluate CCEval using simulation and a real testbed. Each server has two Intel Xeon Gold 5320 CPUs with 52 physical cores (104 logical cores with hyper-threading) and 256GB DRAM. The servers run Ubuntu 22.04.2. Each server is equipped with a Mellanox ConnectX-3 NIC with 100 Gbps link speed and is connected to two Mellanox SN2700 Ethernet switches. Except in Figure 8 and the testbed experiments of §6.4, all experiments are on NS3 running on a single server.
Target workload and network. To evaluate the generality of CCEval on different flow distributions, we use four publicly available flow distributions: WebSearch, GoogleRPC, AliStorage, and FbHadoop [30, 40, 54]; however, since CCEval has similar results on all of them, we only show results using the WebSearch distribution.
The default topology used in most experiments is a largescale FatTree topology with k = 8, which consists of 320 servers with 100 Gbps NICs and 80 switches with 100 Gbps link bandwidth. In a subset of simulation experiments and our hardware testbed, we also use a small-scale DumbBell topology comprising 10 senders and 10 receivers that share one bottleneck link with 100 Gbps bandwidth.
Target CCA and experimental configuration. To show the generality of CCEval on different CCAs, we evaluate the performance of four widely used CC algorithms: DCTCP [3], DCQCN [54], TIMELY [35], HPCC [30]. For each CCA, we use the default hyperparameters in the original paper.
As the default setting, we set the duration of each trial as 0.1 seconds and network load as 30%. We report the flow completion time with different quantiles (90th, 95th, 99th, and 99.9th) of each experiment.
Hyper-parameters of CCEval. Unless otherwise specified, we set the confidence level, (1 − ρ), as 95% with a target confidence interval of 1% relative margin of error, i.e., 1%∗ observed mean. For the model-free algorithm, we use n = 20 in the exploratory stage. For the adaptive cross-entropy algorithm, we use E = 10 epochs and each epoch generates m ce = 10 IS cycles to update the parameters ˜µ, ˜σ of the IS distribution. We use m or = 100 to estimate the length of each cycle in the original distribution, K = 40 for the batch method in the model-based algorithm.
基础设施与测试床
| 配置类别 | 详细信息 |
|---|---|
| 评估环境 | 模拟器环境与真实的物理测试床 |
| 服务器 CPU | 双路 Intel Xeon Gold 5320 CPU,共计 52 个物理核心 (通过超线程提供 104 个逻辑核心) |
| 服务器内存 | 256GB DRAM |
| 操作系统 | Ubuntu 22.04.2 |
| 网卡配置 | Mellanox ConnectX-3 网卡,100 Gbps 链路速度 |
| 交换机配置 | 两台 Mellanox SN2700 以太网交换机 |
| 模拟器运行平台 | 除图8和§6.4节的测试床实验外, 其余所有实验均在单台服务器上运行 NS3 完成 |
目标工作负载与网络
| 配置类别 | 详细信息 |
|---|---|
| 流量分布模型 | WebSearch, GoogleRPC, AliStorage, 以及 FbHadoop (由于四者结果相似,本文仅展示使用 WebSearch 分布的结果) |
| 默认网络拓扑 (大规模) | FatTree (k = 8), 包含 320 台配备 100 Gbps 网卡的服务器,以及 80 台 100 Gbps 链路带宽的交换机 |
| 辅助网络拓扑 (小规模) | DumbBell,由 10 个发送端和 10 个接收端组成,共享一条 100 Gbps 带宽的瓶颈链路 (用于部分模拟实验及硬件测试床) |
目标拥塞控制算法与实验配置
| 配置类别 | 详细信息 |
|---|---|
| 评估的拥塞控制算法 (CCA) | DCTCP, DCQCN, TIMELY, HPCC |
| 算法超参数配置 | 每个 CCA 均使用其原始论文中的默认超参数 |
| 默认实验时长 | 每次试验持续 0.1 秒 |
| 默认网络负载 | 30% |
| 评估的性能指标 | 流完成时间 (FCT) 的第 90, 95, 99, 和 99.9 百分位数 |
CCEval 超参数
| 配置类别 | 详细信息 |
|---|---|
| 目标置信水平 (1 − ρ) | 默认设定为 95% |
| 目标置信区间 | 1% 的相对误差范围 (即:1% * 观测到的均值) |
| 无模型算法探测阶段 (n) | n = 20 |
| 自适应交叉熵算法轮数 (E) | E = 10 epochs |
| 每次epoch生成的 IS 循环数 (m_ce) | m_ce = 10 (用于更新重要性采样分布的参数 ˜µ, ˜σ) |
| 原始分布单周期长度估计 (m_or) | m_or = 100 |
| 基于模型算法的批处理方法参数 (K) | K = 40 |
Note
笔者认为本文是一篇很好的“CCA 综述类型”的文章
但并不是一篇能“凭质量/新insight”中NSDI的文章
Related Work¶
CCA and CCA evaluation. Numerous congestion control algorithms have been proposed since the occurrence of computer networks [26]. Based on the congestion signal used, CCAs can be classified as loss-based [14, 26], delaybased [35], ECN-based [3], and INT-based [30]. Researchers find CCA performance varies across different network scenarios and build benchmarking tools [2,49] based on physical testbeds, simulators [15,25,38], or emulators [31] to conduct experiments [17,18,27,37]. However, none of them focus on the variability and confidence of multi-trial evaluation.
Queuing systems. Some works on queuing systems are close to CCEval. Most of the works focus on single-switch systems [9,19,33]. They either need to model the behavior of a single switch or strongly assume queuing systems will enter a steady state. Since real networks contain many switches and dynamically change due to different flows and CCAs, they cannot be applied to real networks with complex CCAs.
Approximation of CCA trials. Some works (Parsimon [53], m3 [28], and MimicNet [52]) have been proposed for fast and accurate estimation of the tail latency. They still follow the current evaluation workflow and can speed up each trial of CCA experiments compared to NS-3. As shown in §6.2, CCEval is largely orthogonal, but the runtime of CCEval could be further reduced by using these systems.
| 相关工作类别 | 详细内容 | 局限性 / 与 CCEval 的关系 |
|---|---|---|
| CCA and CCA evaluation | 基于不同的拥塞信号,CCA 可分为 loss-based、delay-based、ECN-based 和 INT-based 的算法。研究人员基于物理测试床、模拟器或仿真器构建了基准测试工具来开展实验 |
现有的评估工具均未关注多轮试验评估中的可变性 (variability) 与置信度 (confidence) |
| Queuing systems | 某些排队系统研究与 CCEval 较为接近,但大多专注于单交换机系统,需要对单个交换机的行为进行建模,或者强行假设排队系统会进入稳定状态 | 真实网络包含大量交换机,且会因为不同的数据流和 CCA 而发生动态变化,因此这些方法无法应用于运行复杂 CCA 的真实网络中 |
| Approximation of CCA trials | 提出了诸如 Parsimon, m3, 和 MimicNet 等工作,用于快速、准确地估计尾部延迟。它们依然遵循当前的评估工作流,但相较于 NS-3 能够加速单次 CCA 实验 | 它们与 CCEval 在很大程度上是正交的(相互独立的互补技术)。通过结合使用这些近似系统,可以进一步缩减 CCEval 的运行时间 |
Warning
未来大概率要做 CC 相关的工作
这里留个标记, 应该以后会用上 "CCAs 的分类" 这些偏综述类型的内容